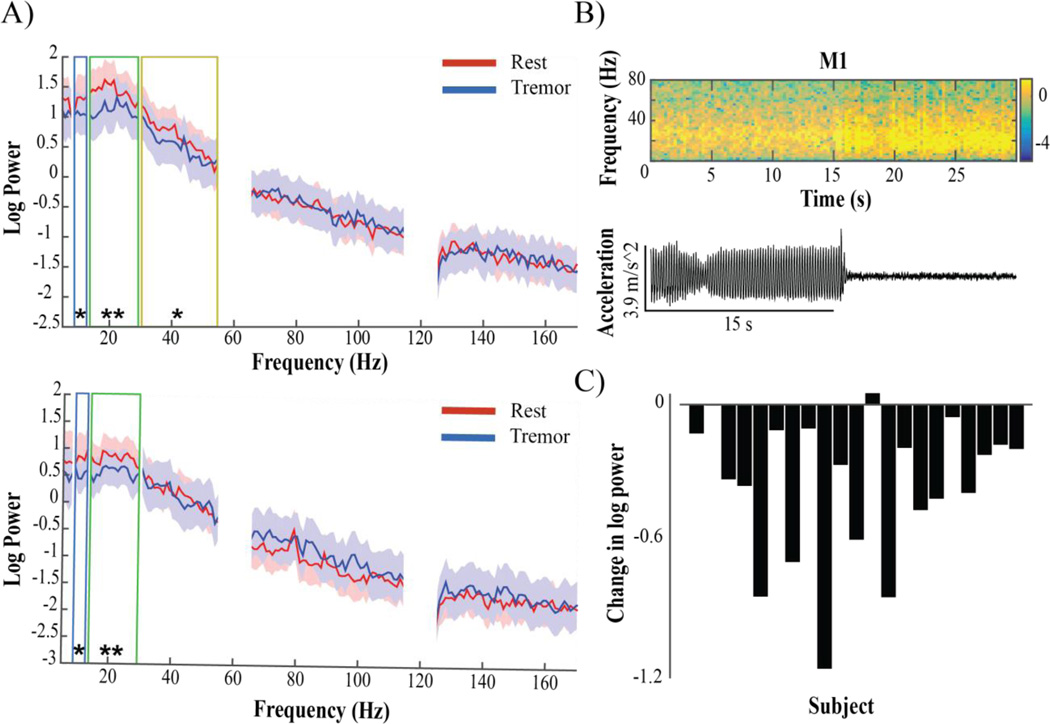
Figure 2.
Spectral changes in M1 and S1 associated with rest tremor. A) M1 (top) and S1 (bottom) median log power spectral density of patients (n=23) during rest without movement (red) and rest tremor (blue). Shading indicates interquartile range (IQR). Boxes correspond to frequency bands in which a significant change was seen: blue – alpha, green – beta, yellow – low gamma. There was no significant difference at any frequency range above low gamma for M1, or above beta for S1. B) Top: Example spectrogram showing timing of log power changes in M1 in one patient relative to tremor offset, seen below in corresponding accelerometer trace. Warmer colors indicate higher values, cooler colors indicate lower values. Most instances of tremor had a more gradual onset and/or offset. C) M1 log beta power difference between conditions in each subject (Tremor-Rest).

