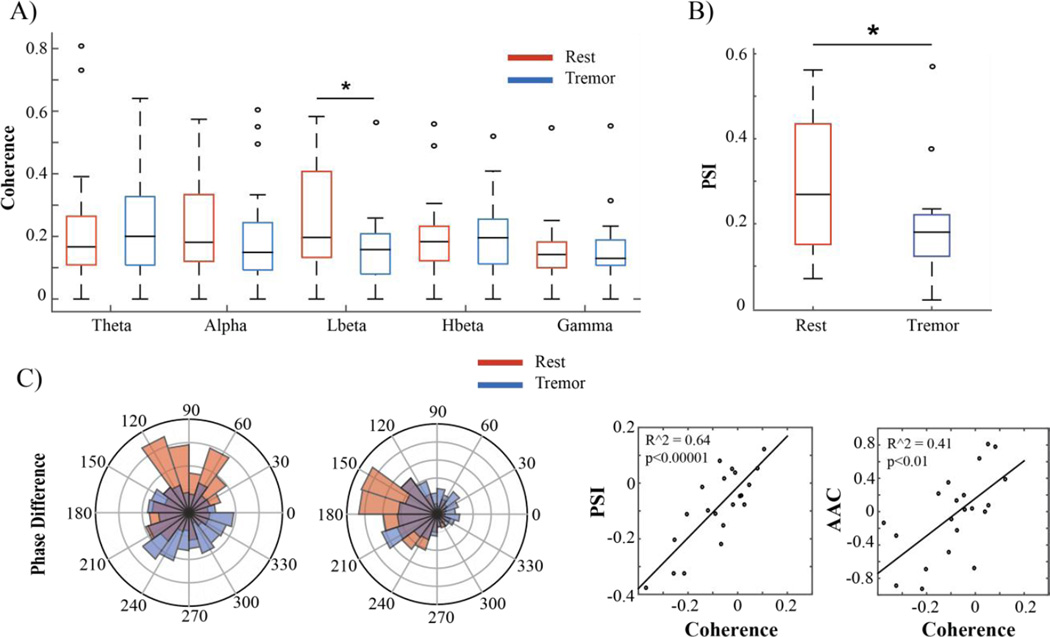
Figure 3.
Cortico-cortical coherence and phase synchrony changes associated with rest tremor. A) Box and whisker plots of magnitude squared coherence between M1 and S1 in different frequency ranges. The boxes represent the second and third quartiles, separated by a black line representing the median. The length of the whiskers is equal to 1.5× the interquartile range (IQR). Open circles represent values beyond 1.5× the IQR. Subjects exhibited a significant decrease in low beta coherence during tremor (blue) when compared to rest (red). B) Low beta PSI between M1 and S1. No other significant differences in cortico-cortical phase synchronization were found. C) Left: Two examples of preferred phase difference between M1 and S1 during rest (red) and tremor (blue). The preferred phase difference at rest was not constant between subjects. Right: Correlation between change in cortico-cortical coherence and cortico-cortical PSI and AAC in the low beta band. Each dot represents the values for one subject.

