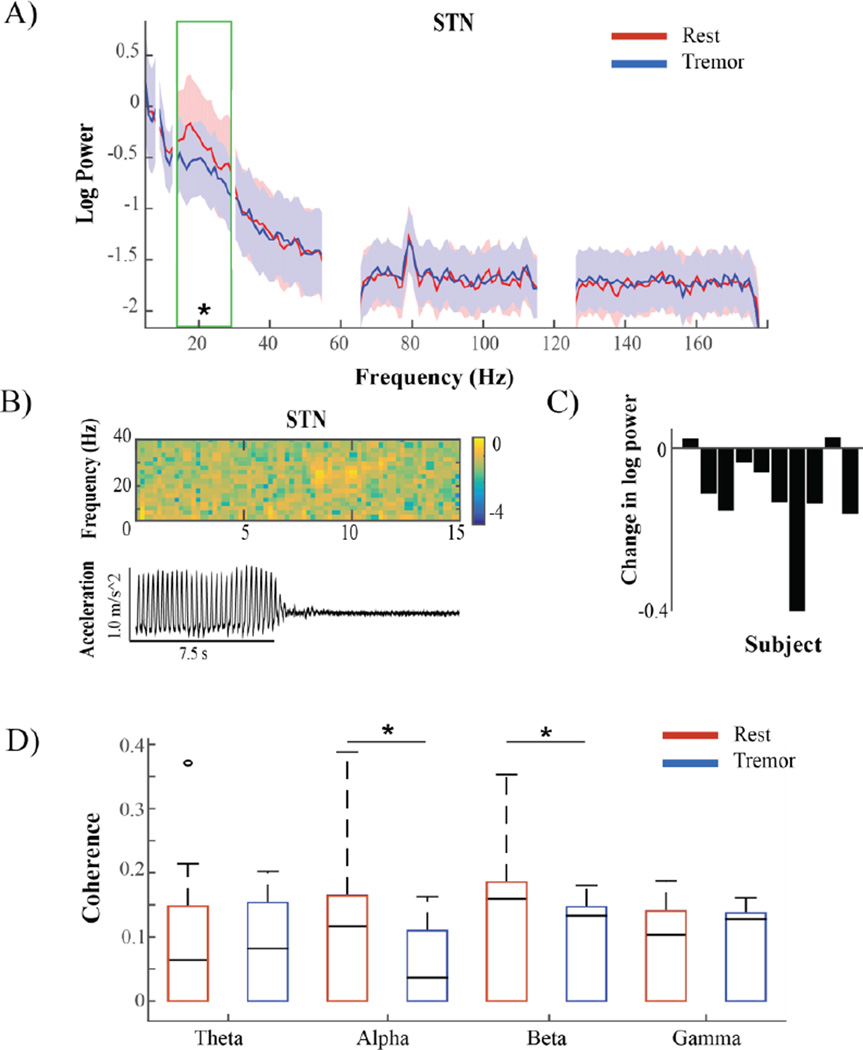
Figure 5.
Tremor associated changes in STN power and connectivity. A) STN median log power spectral density of patients (n=10) during rest without movement (red) and rest tremor (blue). Shading indicates interquartile range (IQR). The green box corresponds to the beta frequency band in which a significant change was seen. B) Top: Example spectrogram showing timing of log power changes in STN in one patient relative to tremor offset, seen below in corresponding accelerometer trace. Warmer colors indicate higher values, cooler colors indicate lower values. C) Log beta power difference between conditions in each subject (Tremor-Rest). D) Magnitude squared coherence between M1 and STN in different frequency ranges. Subjects exhibited a significant decrease in alpha and beta coherence during tremor (blue) when compared to rest (red).

