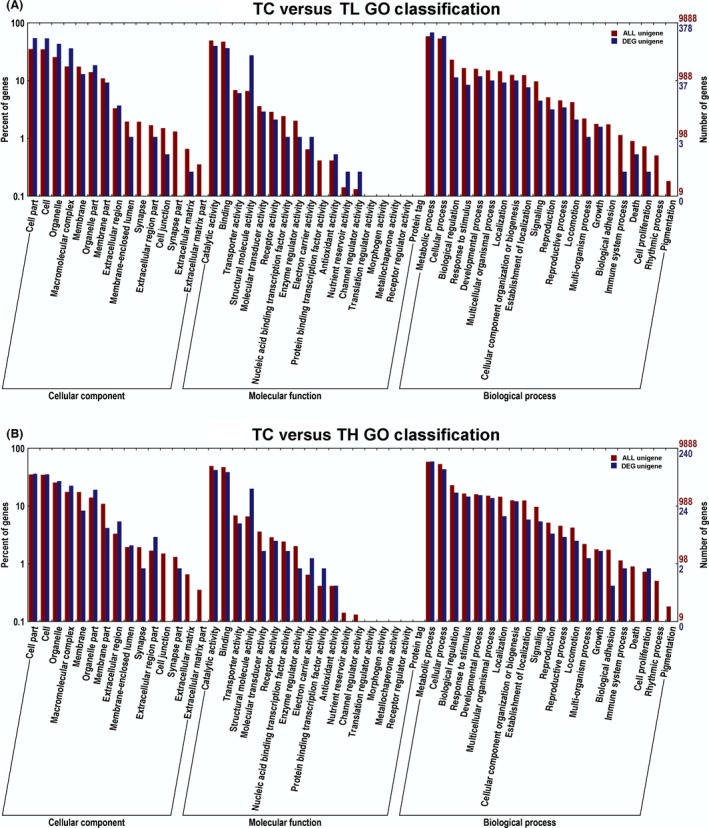
Figure 4.

Histogram of Gene Ontology (GO) classification of differentially expressed genes (DEGs) in TC versus TL (A) and TC versus TH (B). The red histogram indicates all the annotated uigenes in each subcategory, the blue histogram indicates all the annotated DEGs in each subcategory. The right y‐axis indicates the number of annotated genes in each subcategory, the red numbers corresponding to the annotated uigenes, the blue numbers corresponding to the annotated DEGs. The left y‐axis indicates the percentage of annotated uigenes or DEGs in that main category.
