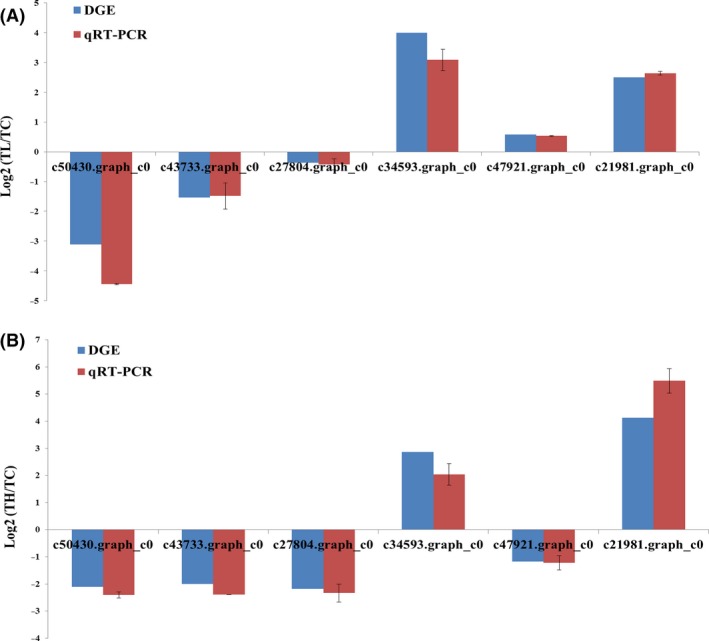
Figure 7.

qRT‐PCR validation of mRNA‐seq data for unigene expression levels. The y‐axis indicates the relative expression levels, (A) represent each unigene in TL compared with TC, (B) represent each unigene in TH compared with TC, each error bar indicates the standard error.
