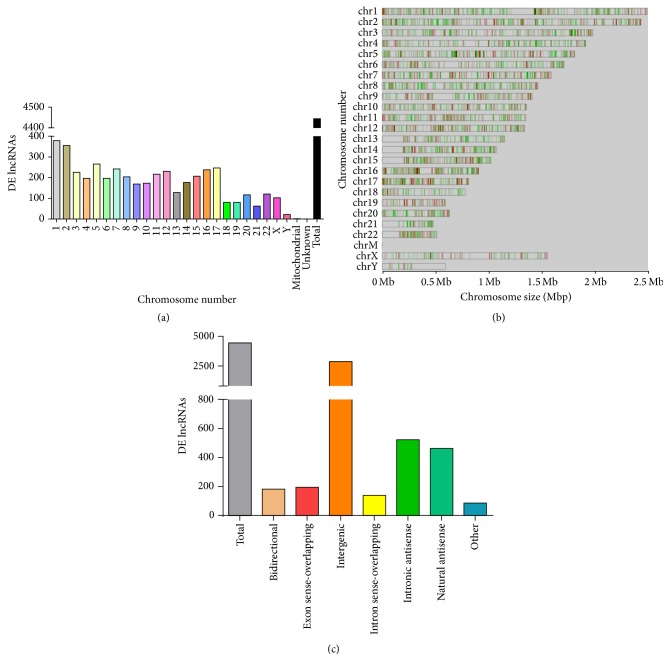
Figure 2.
Distribution, location, and classification of differentially expressed lncRNAs in HUVECs exposed to TGFβ1 (10 ng/mL) versus control. Demonstration of (a) numbers and (b) chromosomal location of differentially expressed (DE) lncRNAs on different chromosomes. (c) Bar graph representing types of differently expressed lncRNAs, depending on their genomic location.

