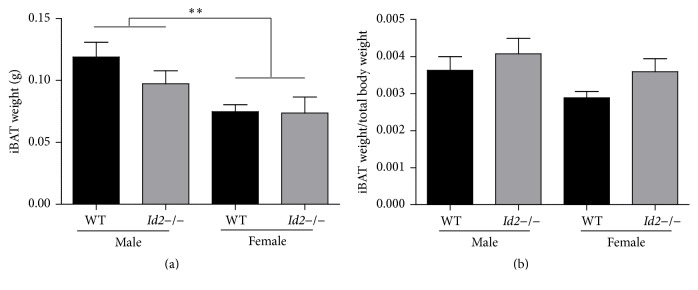
Figure 2.
Brown Adipose tissue weight in Id2−/− mice. (a) Interscapular brown adipose tissue (iBAT) mass (g) from WT and Id2−/− mice. (b) Ratio of weight of iBAT tissue to total body mass from WT and Id2−/− mice. Values are mean ± SEM. Two-factor ANOVAs were performed followed by Tukey's post hoc tests, ∗∗ p < 0.01. No significant differences were observed between groups in the iBAT mass/body mass analysis.

