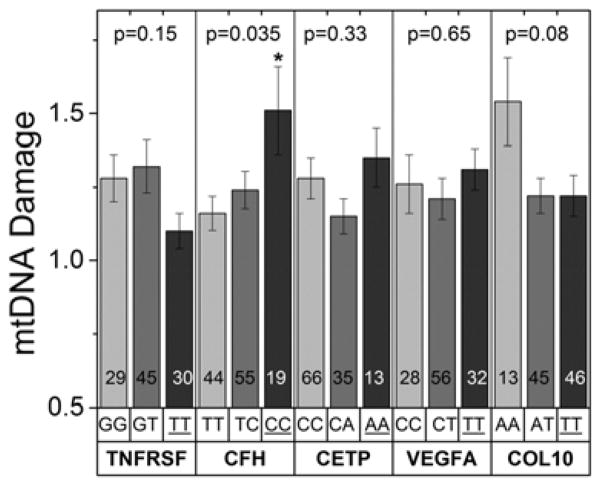
Figure 3. RPE mtDNA damage and AMD-associated risk variants.
Donors were separated into genotypes for five risk variants that are associated with cell survival (TNFRSF10A), the complement pathway (CFH), lipid transport/metabolism (CETP), angiogenesis (VEGFA) and remodeling of the extracellular matrix (COL10A1). Graphs show the amount of mtDNA damage (relative to the average damage of MGS1 control donors) for donors within each genotype. Genotypes are shown above the gene name; the homozygous risk alleles (dark grey bars) are underlined. The number of donors in each group is shown within the bars. mtDNA damage was compared between non-risk, heterozygous risk, and homozygous risk for each gene by one-way ANOVA and Tukey’s post-hoc test when required. The probability values are provided in the graph for each comparison. Significance was set at p=0.04 following the Benjamini-Hochberg correction for multiple comparisons. * Tukey’s post-hoc test showed CC is significantly higher than TT for CFH.

