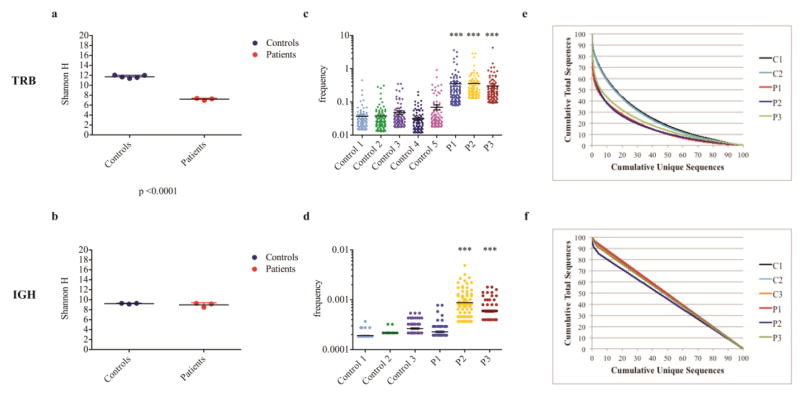
Fig. 3. Evaluation of TRB and IGH repertoire diversity shows modest clonal expansions.
The Shannon Entropy index (H) was used to measure repertoire diversity in unique TRB (a) and IGH (b) sequences in each patient and controls. Groups of 3 controls and 3 patients (P1-P3) are shown, black bars indicate mean values, colored bars the SD. The top 100 most abundant unique TRB (c) and IGH (d) clones were considered, and their frequency was reported as referred to the cumulative number of sequences in the whole data set. Horizontal bars indicate mean value (***, p≤0.001). The cumulative frequencies of total TRB (e) and IGH (f) sequences are plotted against the cumulative frequencies of unique sequences in controls (C1-C3) and patients (P1-P3).

