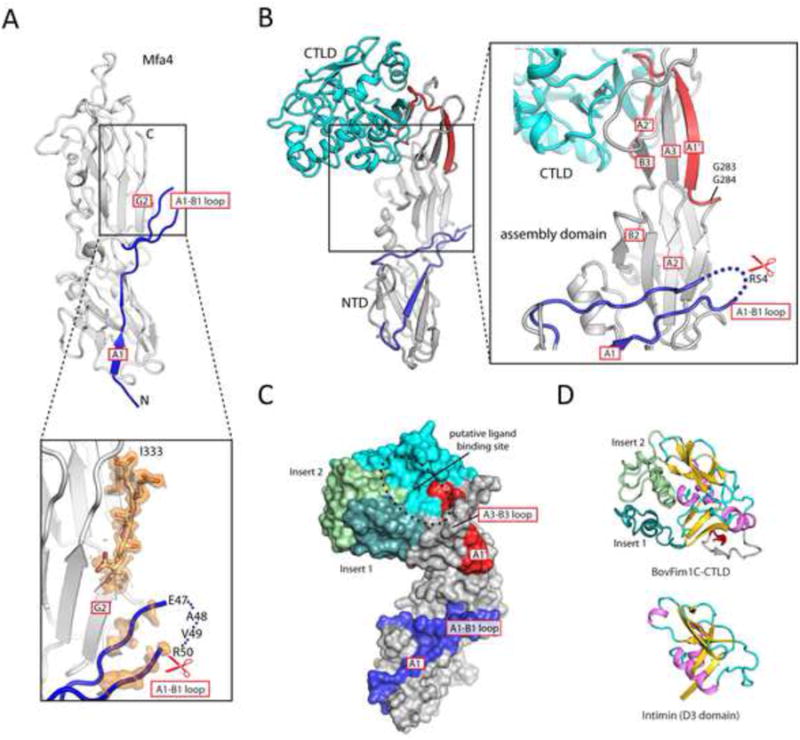
Figure 6. Representative structures of tip pilins.

(A) Crystal structure of the tip pilin Mfa4. The unbiased experimental electron density map (solvent modified) of the A1-B1 loop and the C-terminus are shown (contoured at 1 σ, orange).
(B) The structure of BovFim1C consists of a prototypical pilus assembly domain (gray/blue/red) connected to a C-terminal CTLD (cyan).
(C) Surface representation of BovFim1C color coded as in B with inserts in green.
(D) Structural comparison of the CTLD domain of BovFim1C with another bacterial CTLD. The common core regions are colored in violet/gold/cyan.
