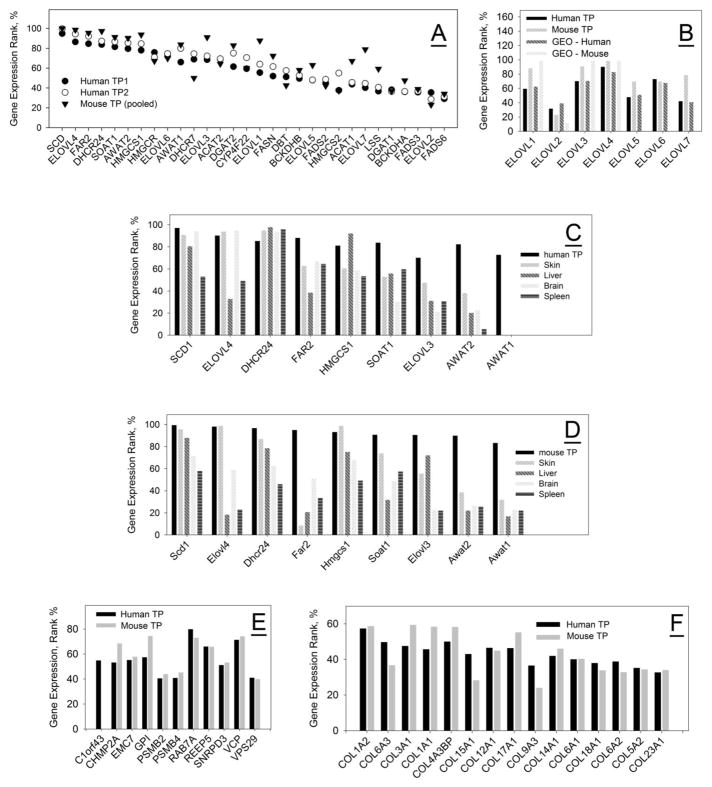
Figure 4. Analysis of gene expression patterns in the tarsal plates of humans and mice.
Panel A. Direct comparison of expression profiles of lipid metabolism-related genes in tarsal plates of humans (TP1 and TP2, circles) and mice (pooled samples; triangles). For clarity, only human genes are labeled.
Panel B. Expression profiles of ELOVL enzymes in human (average of two samples) and mouse tarsal tissues. Note that GEO datasets GDS 1832, 1361, and 1009, unlike our data, do not report any presence of ElovL5, Elovl6, and Elovl7 in MG of mice.
Panel C. Comparison of expression profiles of major lipid-synthesizing enzymes in selected human tissues (tarsal plates – our data; other tissues – from GEO dataset GDS3113)
Panel D. Comparison of expression profiles of major lipid-synthesizing enzymes in selected mouse tissues (tarsal plates – our data; other tissues – from GEO dataset GDS3334)
Panel E. Average expression profiles of reference house-keeping genes in tarsal plates of humans and mice.
Panel F. Direct comparison of average expression profiles of collagen-encoding genes in tarsal plates of humans and mice.

