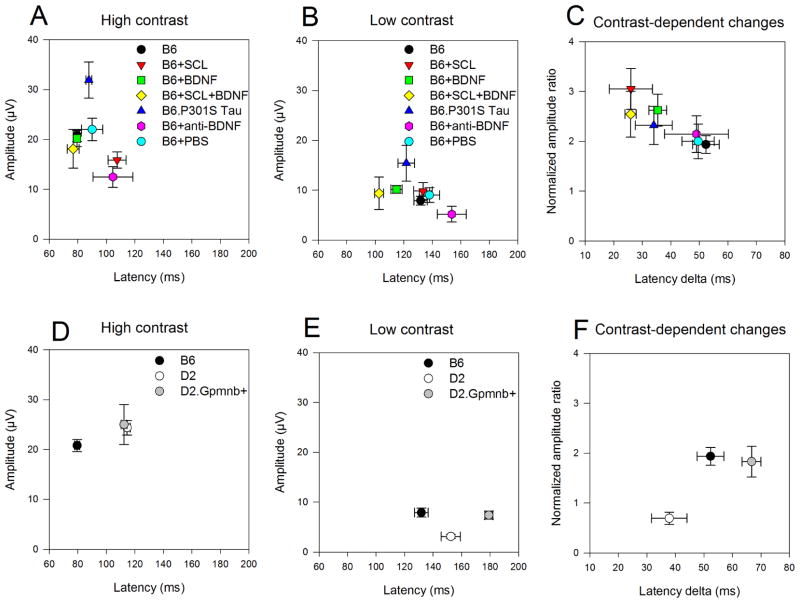
Figure 3.
Effect of contrast on PERG amplitude and latency for different mouse groups. Top panels: B6 mice exposed to different conditions of neurotrophic support (A–C). Bottom panels: Mice with different genotype (D–F). A, D: mean (±SEM) amplitudes as a function of corresponding mean (±SEM) latencies for stimuli of 1.0 contrast. B, E: mean (±SEM) amplitudes as a function of corresponding mean (±SEM) latencies for stimuli of 0.2 contrast. C, F: Normalized mean (±SEM) amplitude ratios [(amplitude at 0.2 contrast ÷ amplitude at 1.0 contrast) ÷ 0.2] as a function of mean (±SEM) latency deltas (latency at 0.2 contrast minus latency at 1.0 contrast). Note in all panels that there is a sizeable separation between mouse groups, and that the distribution of mouse groups may depend on the contrast level. B6, control C57BL/6J; B6+SCL, lesion of the contralateral superior colliculus one month before; B6+BDNF, 2 weeks after intravitreal injection of BDNF; B6+SCL+BDNF, 2 weeks after intravitreal injection of BDNF in mice with lesion of the contralateral superior colliculus; B6.P301S Tau, mice transgenic for human mutant P301S Tau; B6+anti-BDNF, 2 weeks after intravitreal injection of anti-BDNF; B6+PBS, 1 week after intravitreal injection of PBS; D2, DBA/2J mice 4 months old; D2.Gpnmb+, mice coisogenic with D2 that have a Gpnmb gene with normal function.

