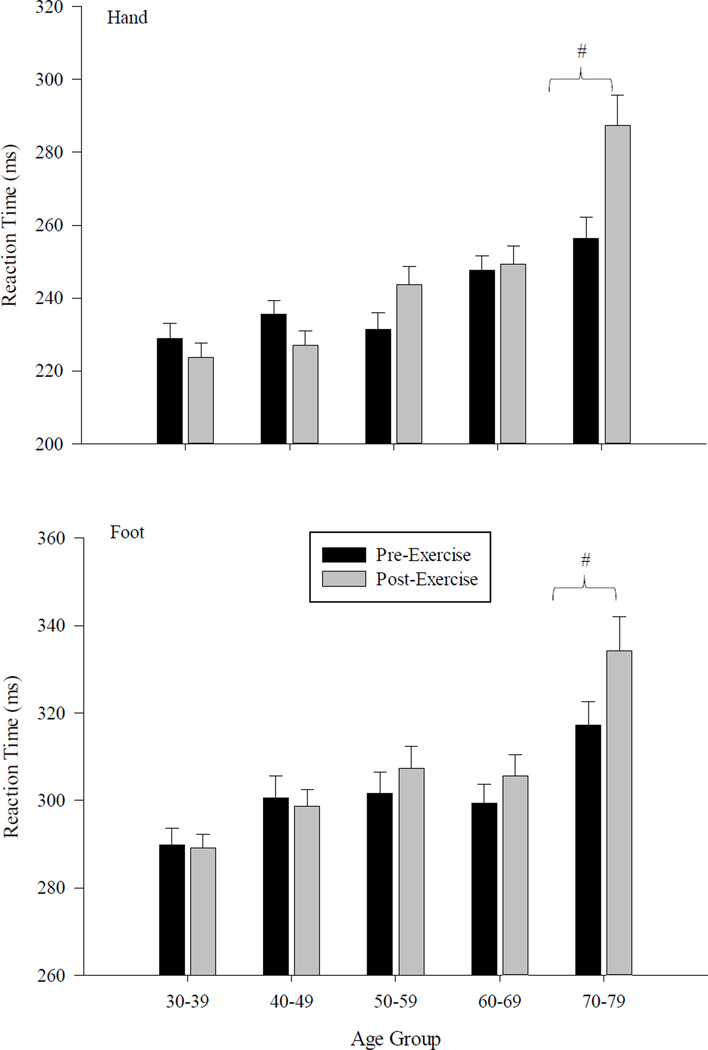
Figure 3.
Bar graph depicting differences in mean simple reaction time for the hand and the foot. Differences are shown across the five age groups and as a function of the fatigue intervention. Error bars represent one SE of the mean. Significant differences between age groups are denoted by an asterisk (*) while significant effects due to the fatigue protocol are denoted with a hash mark (#).

