
Figure 2.
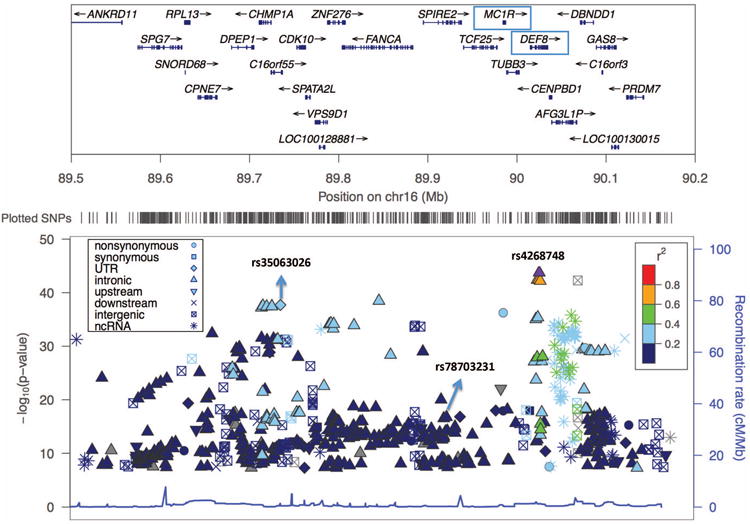
Manhattan plot enlargement showing 0.7 Mb region at the 16q24 locus.
The upper panel shows the name and location of genes in the region, with an arrow indicating the transcribed strand of a gene and ticks indicating exons. The genes DEF8 (containing the top SNP rs4268748) and MC1R (associated with skin pigmentation and skin cancer) are shown in boxes. The lower panel shows the significance levels of the SNPs in this region, with labels for the three SNPs that are independently associated with SCC risk.