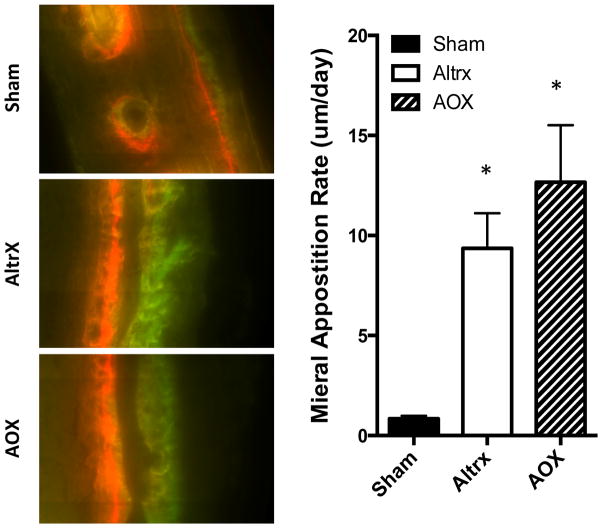
Figure 5. UHMWPE particle-induced mineral apposition rates.
Half of tissue of the calvaria described in Figure 4 were processed for undemineralized histology, and representative fluorescent images obtained at 100 X magnification are shown to illustrated the alizarin red and calcein green double labels measured to quantify the mineral apposition rates MAR. Note the significantly greater MAR in the particle treated calvaria (*p<0.001 vs. sham; p=0.2444, AOX vs. Altrx).

