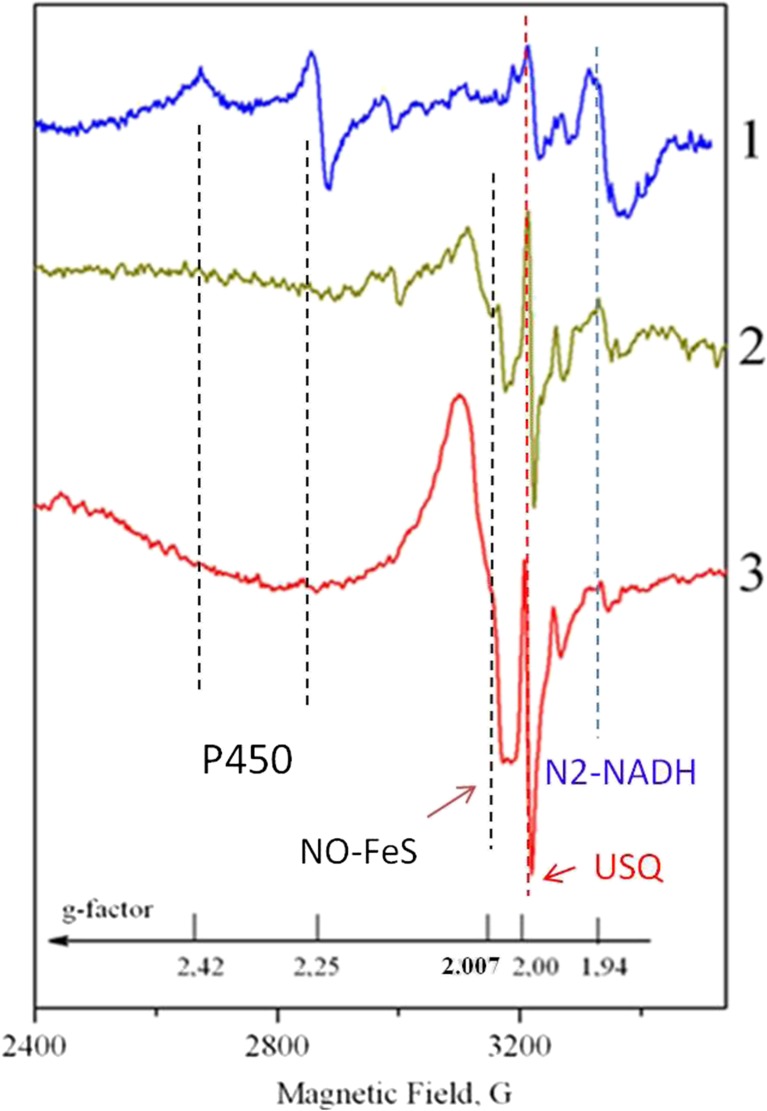
Fig. 1.
ESR spectra of the stomach tissue cells taken at the different distances from the tumor. Curve 1–5 cm from the tumor; curve 2–2.5 cm from the tumor; curve 3 – stomach wall tissues (1.5 cm from the tumor). The magnetic field strength and corresponding g-factors are shown along the x-axis. The dashed lines indicate the ESR features undergoing the prominent transformations. The details of the ESR lines assignment are given in the text

