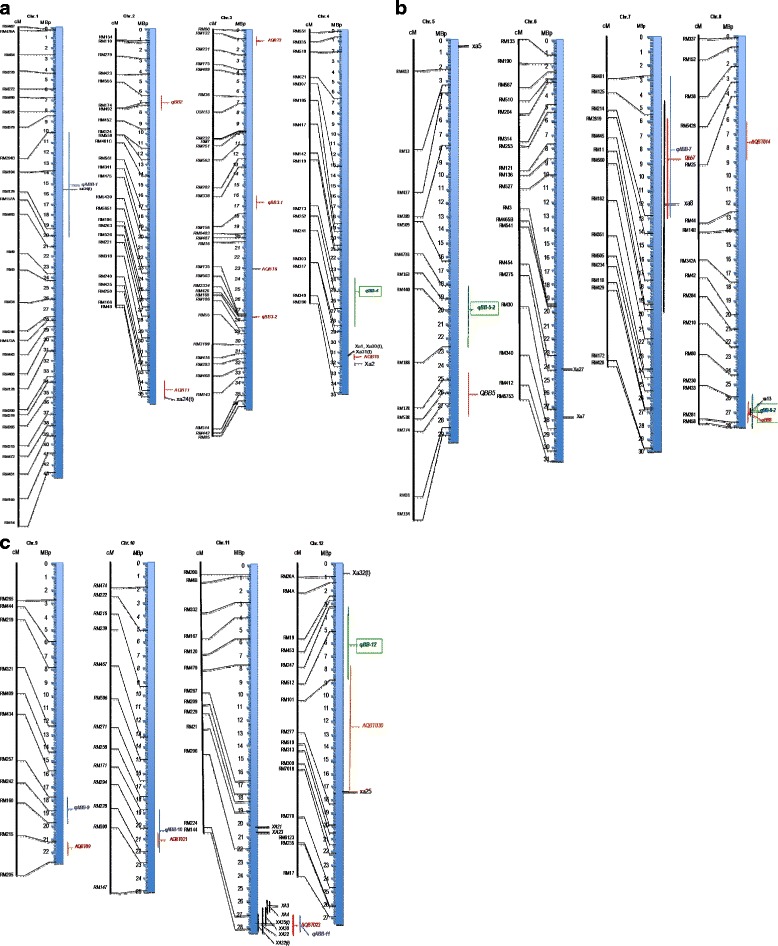
Fig. 3.

a, b and c: Integrative map showing all known resistance QTLs/genes to African and Asian Xoo. The vertical graduated blue thick lines represent the physical map of each chromosome and is linked to the genetic map on the left showing the microsatellites markers (RM). On the right size of each physical map the genes and QTLs are indicated in red, black and green. In black are the R genes that were previously identified with Asian Xoo strains. R genes that were cloned are indicated by a horizontal line to a specific location on the physical map. The genes that are not cloned yet are represented by a vertical line indicating the confidence interval. In red we indicated QTLs that were detected in others rice breeding populations. Novel QTLs identified using the African Xoo strains are represented in blue those induced by the Philippines strains PXO61 and PXO86 are shown in green
