
Fig. 4.
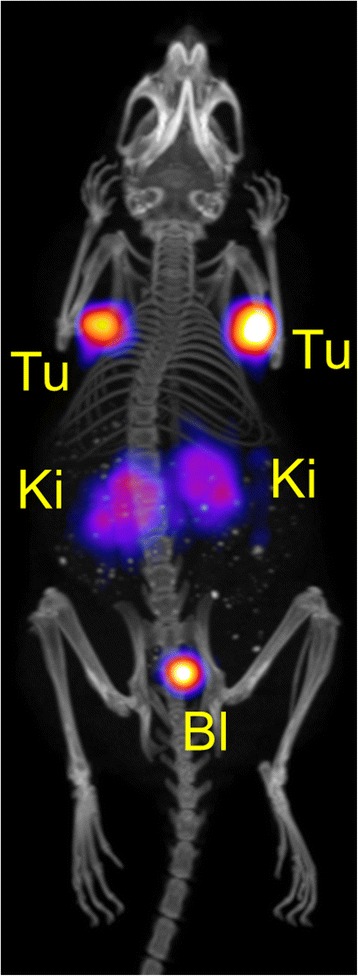
PET/CT image shown as maximal intensity projection of an AR42J tumor-bearing mouse 2 h after injection of Tb-DOTANOC (3.4 MBq; 0.34 nmol DOTANOC). During the in vivo scan the mouse was anesthetized with a mixture of isoflurane and oxygen. The image is presented with the scale adapted to allow visualization of tumors and kidneys. (Tu = AR42J tumor xenograft, Ki = kidney, Bl = urinary bladder)