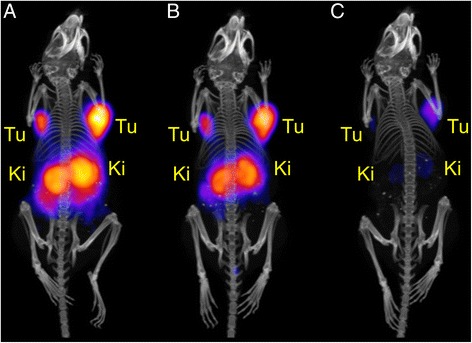
Fig. 5.

a–c PET/CT images shown as maximal intensity projections of an AR42J tumor-bearing mouse at different time points after injection of 152Tb-DOTANOC (25 MBq; 2.5 nmol DOTANOC). a PET/CT image at 5 h after injection of 152Tb-DOTANOC; b PET/CT image at 8 h after injection of 152Tb-DOTANOC, and c PET/CT image at 22 h after injection of 152Tb-DOTANOC. During the in vivo scan, the mouse was anesthetized with a mixture of isoflurane and oxygen. The images are presented with the scale kept at an equal level for all time points in order to reflect the effective activity retained in the mouse. (Tu AR42J tumor xenograft, Ki kidney)
