Fig. 3.

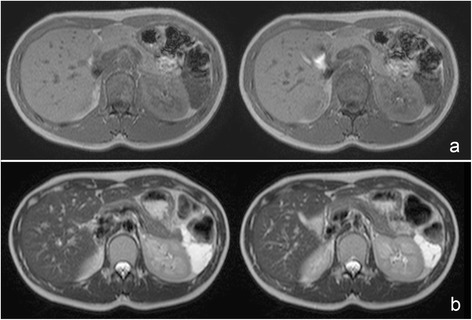
Magnetic resonance imaging revealed the mass low intensity in the T1-weighted image (a) and high intensity in the T2-weighted image (b)

Magnetic resonance imaging revealed the mass low intensity in the T1-weighted image (a) and high intensity in the T2-weighted image (b)