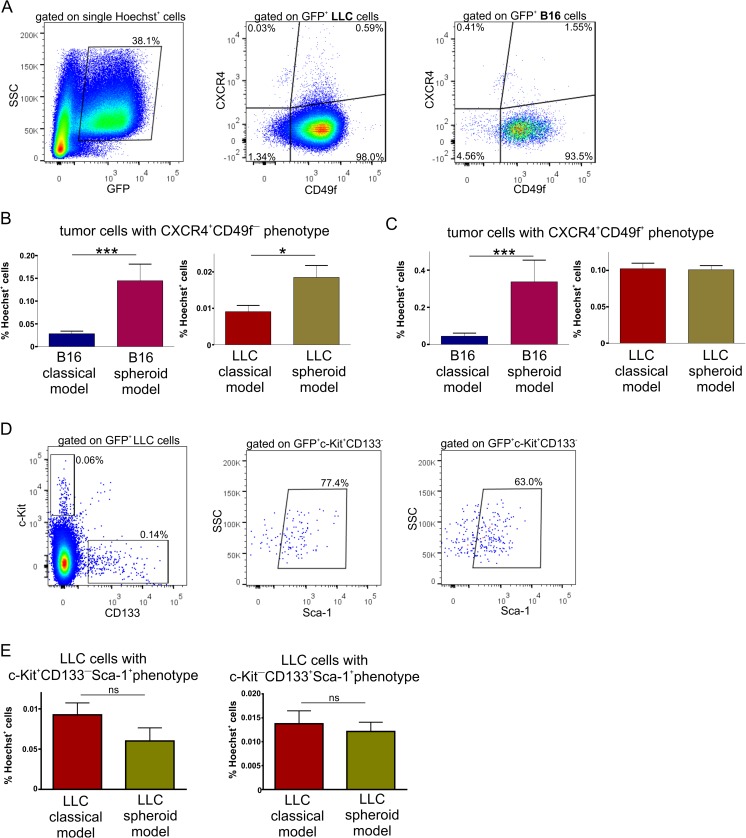
Fig. 6.
Analysis of stem cell markers expression in tumors from spheroid-plug and classical model. a Representative flow cytometry analysis of CXCR4 and CD49f expression on tumor cells. b The CXCR4+CD49− subpopulation in spheroid-plug model in both B16 and LLC tumors. c The CXCR4+CD49+ subpopulation—in B16 tumors and LLC tumors. d, e c-Kit+CD133−Sca-1+ and c-Kit−CD133+Sca-1+ population among LLC tumors, **p < 0.01 Mann–Whitney test

