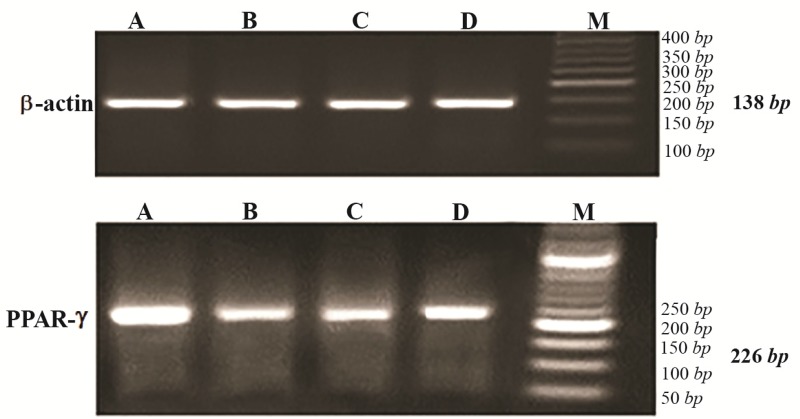
Figure 2.
Agarose gel electrophoresis of RT-PCR products of PPARγ expression (226 bp) and β actin as internal control (138 bp) for experimental groups, stained with gel red. A) control group; B) diabetic group; C) diabetic rats received 10 mg/kg pioglitazone; D) diabetic rat received 400 mg/kg aquatic extract of stevia.

