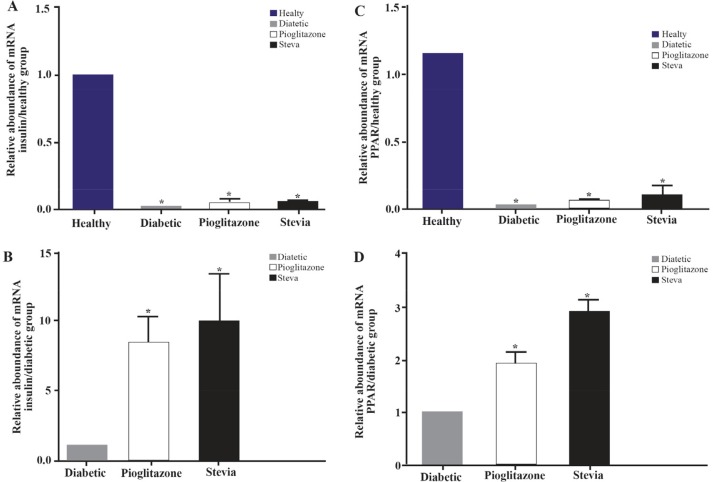
Figure 6.
The PPARγ and insulin mRNA expression were measured by real time PCR and analyzed with the 2 ΔΔCT method. Comparisons between different treated groups were performed using One Way ANOVA. Part A, C compared to control and B, D compared to diabetic rats for PPARγ and insulin mRNA expression. Values are mean±SEM (n=5) *p<0.05.

