
Fig. 6.
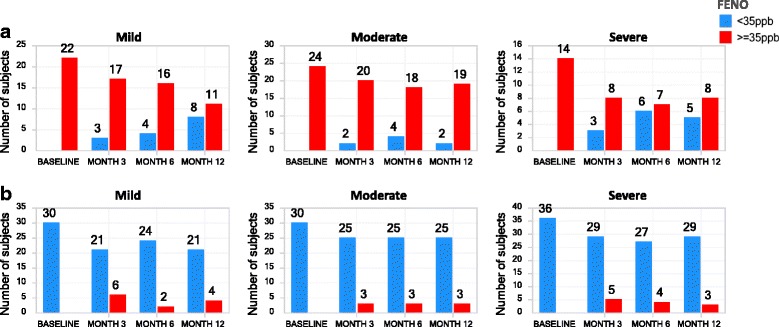
Longitudinal stability of FENO phenotypes. The number of asthma subjects (y-axis, number label) with FENO-high (≥35 ppb, red bars) and FENO-low (<35 ppb, blue bars) phenotypes, at the indicated visit (x-axis) are shown for subjects with FENO ≥ 35pbb (a) or FENO < 35 ppb (b) at the baseline visit, stratified by asthma severity cohort