Fig. 9.

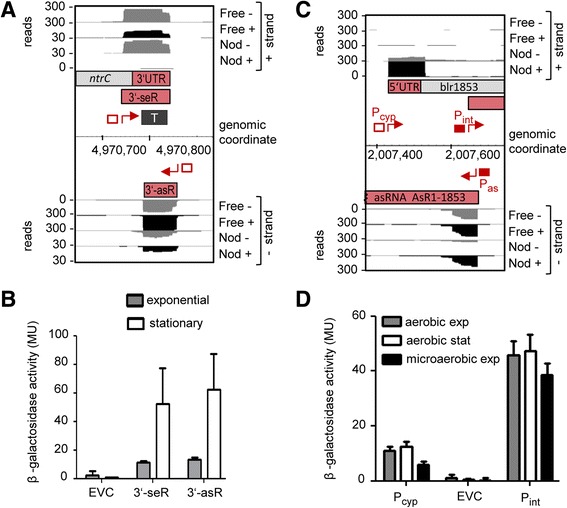
Promoter activities in the 3′-region of ntrC and upstream of blr1853 under different conditions. a The 3′-region of ntrC with two convergent TSSs without mapped promoters: Bja_TSS_8751 of the sRNA 3′-seR and Bja_TSS_8753 of the asRNA 3′-asR (designated no. 11, and 12 in Fig. 5). b The promoter activities of the regions upstream of the two TSSs shown in a were measured in the exponential and stationary growth phases. c The blr1853 locus with three TSSs: Bja_TSS_3937 preceded Pcyp, Bja_TSS3938 preceded by Pint and Bja_TSS_3939 preceded by Pas (the respective numbers of these TSSs in Fig. 5 are no. 10, 15 and 13). d The activities of the promoters Pcyp and Pint were measured in aerobic cultures grown to the exponential and stationary growth phase, and in exponentially growing cultures under microoxic conditions. For the analysis of Pas, see Fig. 4d. a and c show cDNA reads, mapped TSSs (red flexed arrows), mapped promoters (red filled rectangles), TSS upstream regions with promoter activities lacking mapped promoters (red empty rectangles), a mapped terminator (dark grey rectangle marked with T), mRNAs (bars with differently colored regions – light grey and red depicting annotated ORFs and UTRs, respectively) and new transcripts (red bars representing internal sense RNAs or as RNAs). b and d show the results from beta-galactosidase measurements in B. japonicum. Respective 200 nt TSS upstream regions were cloned in front of the lac-operon. Shown are results from three independent experiments with technical duplicates and error bars depicting the standard deviation
