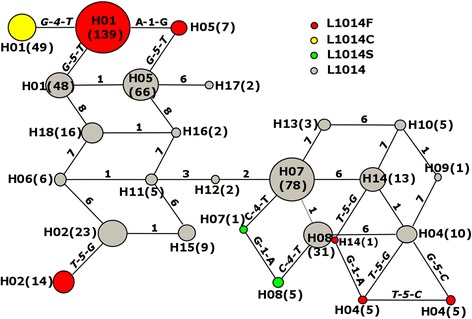
Fig. 2.

kdr haplotype networks showing the genealogical relationship for Anopheles sinensis. Each haplotype is represented by a circle with size proportional to its frequency in the sample (sample size in parentheses, 2 N = 546). Mutational steps are represented by lines with the indication of the mutation from the immediate ancestral haplotype (kdr mutations in bold). Grey circles: wild-type L1014 allele. Red circles: mutant L1014F allele (G-5-T or G-5-C). Yellow circles: mutant L1014C allele (T-4-G). Green circles: mutant L1014S allele (T-4-C). The numbers from 1 to 8 on the connection lines represent the nucleotide positions at 181, 940, 943, 1161, 1162,1197, 1210 and 1226 when compared with a template sequence (GenBank KP763726)
