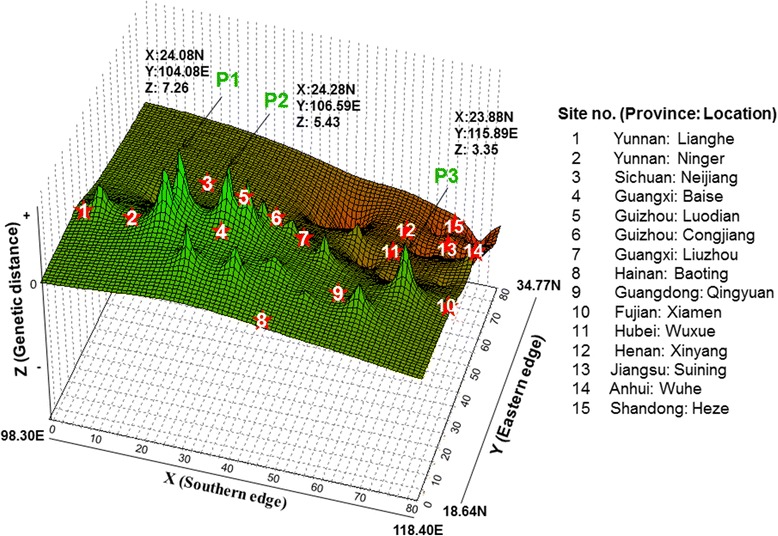
Fig. 4.

Genetic landscape shape plot showing patterns of spatial genetic distance for 15 populations of Anopheles sinensis. Geographical coordinates are shown in the X (North–south) and Y (East–west) axes. Z axis (height) corresponds to the genetic distance between individuals. Green peaks (P1, P2 and P3) are indicative of areas with high pairwise genetic distances and red valleys are indicative of areas of low pairwise genetic distance
