
Fig. 5.
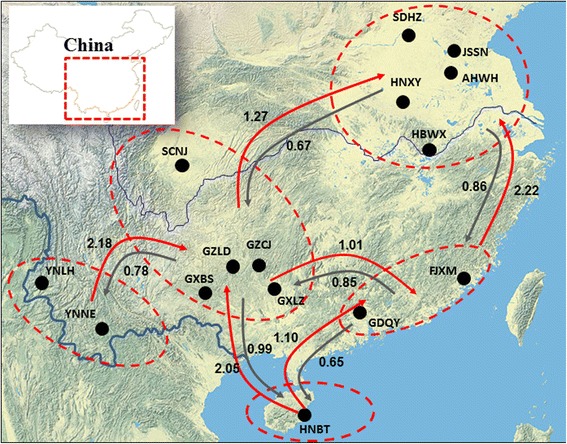
Bayesian estimates of historical asymmetrical migration between populations of Anopheles sinensis. The five locality groups are indicated by dotted circles and arrows indicate the direction of migration rates
Official websites use .gov
A
.gov website belongs to an official
government organization in the United States.
Secure .gov websites use HTTPS
A lock (
) or https:// means you've safely
connected to the .gov website. Share sensitive
information only on official, secure websites.
Bayesian estimates of historical asymmetrical migration between populations of Anopheles sinensis. The five locality groups are indicated by dotted circles and arrows indicate the direction of migration rates