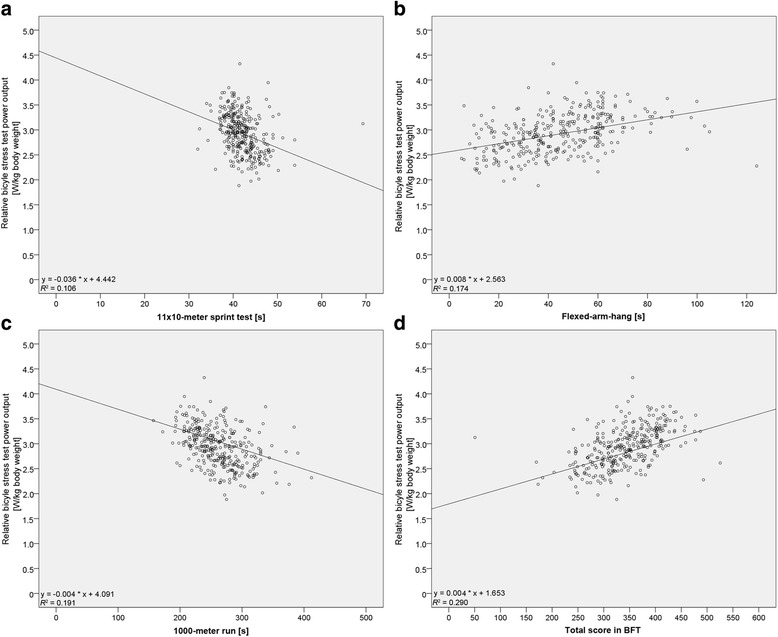
Fig. 1.

Scatter plots of the correlations. Scatter plots of the results achieved in the sprint test (a), flexed-arm hang (b) 1000-m run (c) and total score of BFT (d) in correlation with the relative power output measured during the bicycle stress test and illustration of the relevant regression lines. n = 323
