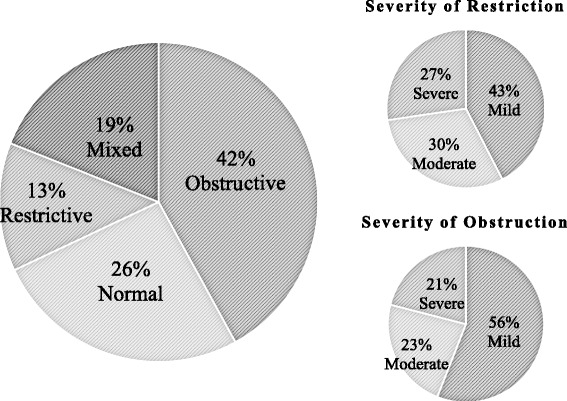
Fig. 2.

Prevalence and severity of abnormal lung functions. Pie charts showing the prevalence of the different types of lung function abnormalities (large pie chart, N = 501). The smaller pie charts show the severity of patients who had restrictive (small upper, n = 65) and obstructive abnormalities (small lower, n = 210)
