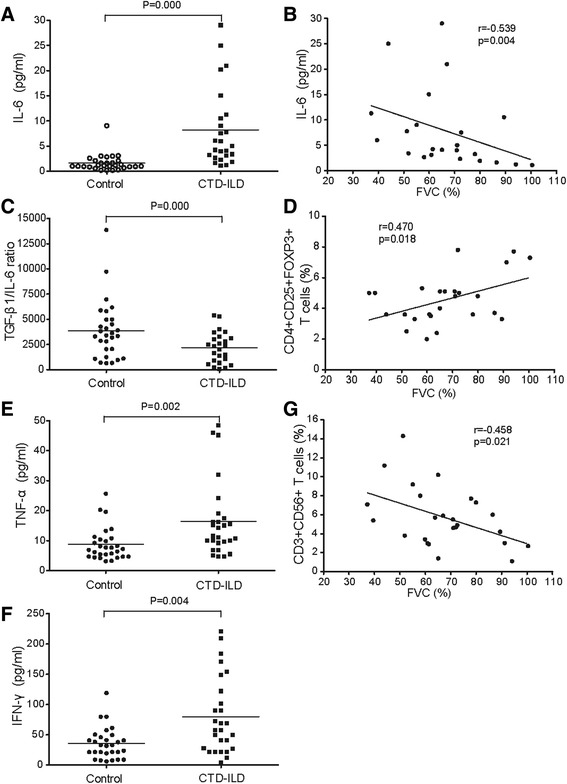
Fig. 3.

Correlations of the altered T cell subsets and cytokine profiles with pulmonary functions in the patients with CTD-ILD. a, c, e, f) The plasma levels of IL-6, TGF-β/IL-6 ratio, TNF-α, and IFN-γ in the CTD-ILD patients who had not received corticosteroid therapy (n = 27) and healthy control subjects (n = 29). Each point represents one person. The median value for each group is indicated by a horizontal line. b, d, g Correlations of forced vital capacity (FVC) with the altered T cell subsets and cytokines. b, d Correlations of the increased plasma IL-6 level or declining peripheral blood regulatory T cells (Tregs) with worsening FVC. g Correlations of the elevation of CD3+CD56+ NKT cells with the reduction of FVC. P values were obtained by Pearson’s test. IL-6 interleukin-6, TGF-β transforming growth factor-β, TNF-α tumor necrosis factor α, IFN-γ interferon γ, NKT natural killer T cells, FVC forced vital capacity
