
Fig. 1.
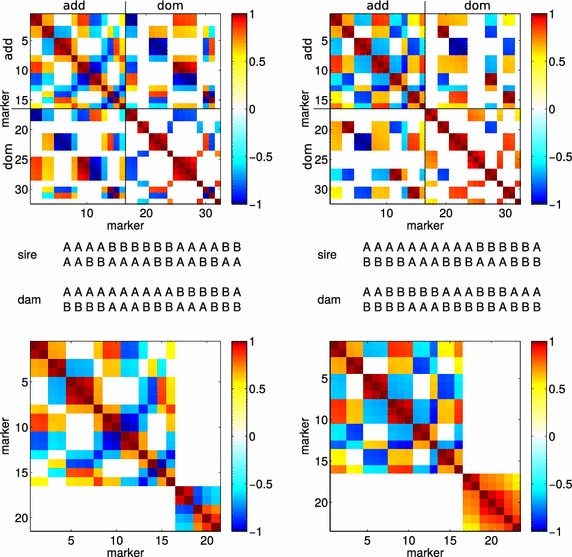
Correlation matrices for two matings (top) with their respective phased genotypes (middle). The marker distance is 1 cM. The dimension of both matrices is 32 due to the additive and dominance effects at the 16 markers. Block diagonal matrices (bottom) remain after the rows and columns of dominance effects are deleted when there is a perfect correlation between a dominance and additive effect at the same locus