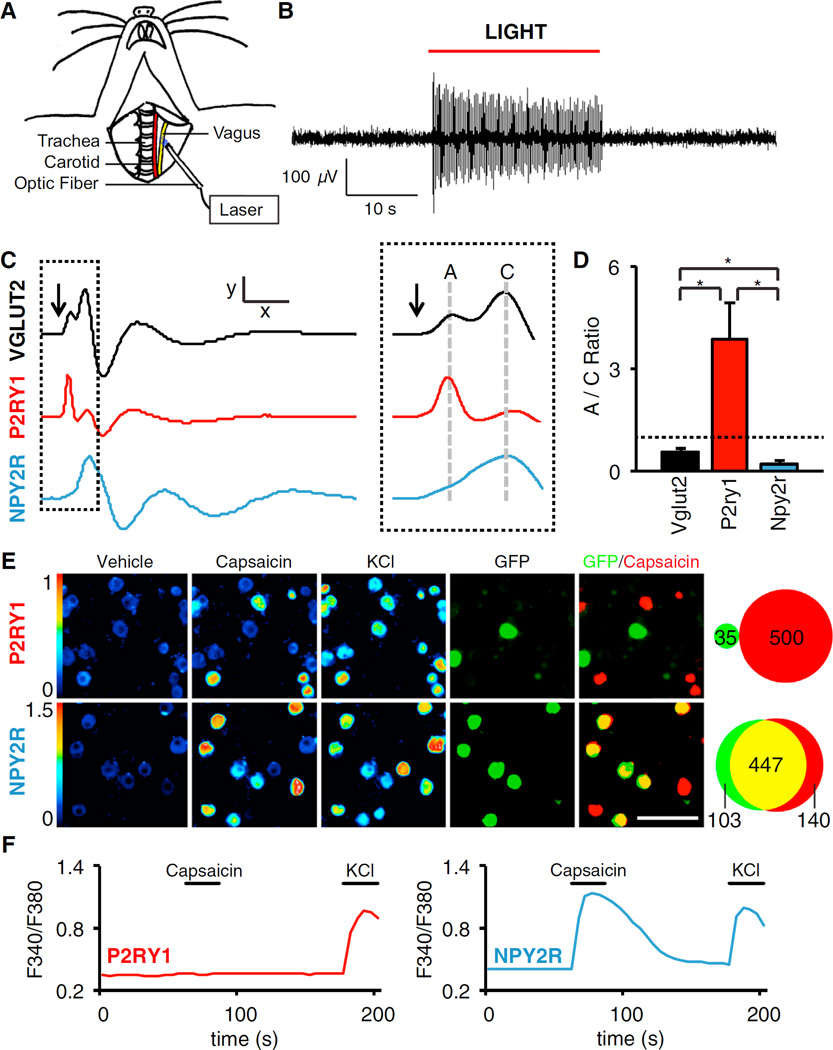
Figure 3. Characterization of Vagal P2ry1 and Npy2r Neurons.
(A) Cartoon depiction of optogenetic strategy. The vagus nerve is surgically exposed in anesthetized mice and illuminated to activate ChR2-expressing sensory neurons.
(B) Whole nerve electrophysiological recordings in Vglut2-ChR2 mice revealed light-induced action potentials.
(C) Compound action potentials following brief optogenetic stimulation (arrow) in Vglut2-ChR2, P2ry1-ChR2, and Npy2r-ChR2 mice. A and C fibers were classified based on conduction velocity (Figure S4) x = 5 ms, y = 110 µV (Vglut2), 62 µV (P2ry1), 160 µV (Npy2r), and dashed inset, x = 1.45 ms.
(D) The ratio of A to C fibers was calculated by integrating corresponding peak area in the compound action potential; dashed line: A/C ration of1 (n = 5–8, mean ± SEM, and *p < 0.05).
(E) Calcium imaging of single neuron responses to capsaicin (2 µM) and KCl (50 mM) in acute ganglia cultures from P2ry1-ires-Cre; lox-L10-GFP and Npy2r-ires-Cre; lox-L10-GFP mice. (Left panels, color scale = 340/380 nm Fura-2 excitation ratio and right panels, neurons expressing GFP [green, native fluorescence] and responding to capsaicin [red] are superimposed and counted). Scale bar, 100 µm.
(F) Representative traces for single neurons imaged in (E). See also Figure S4.

