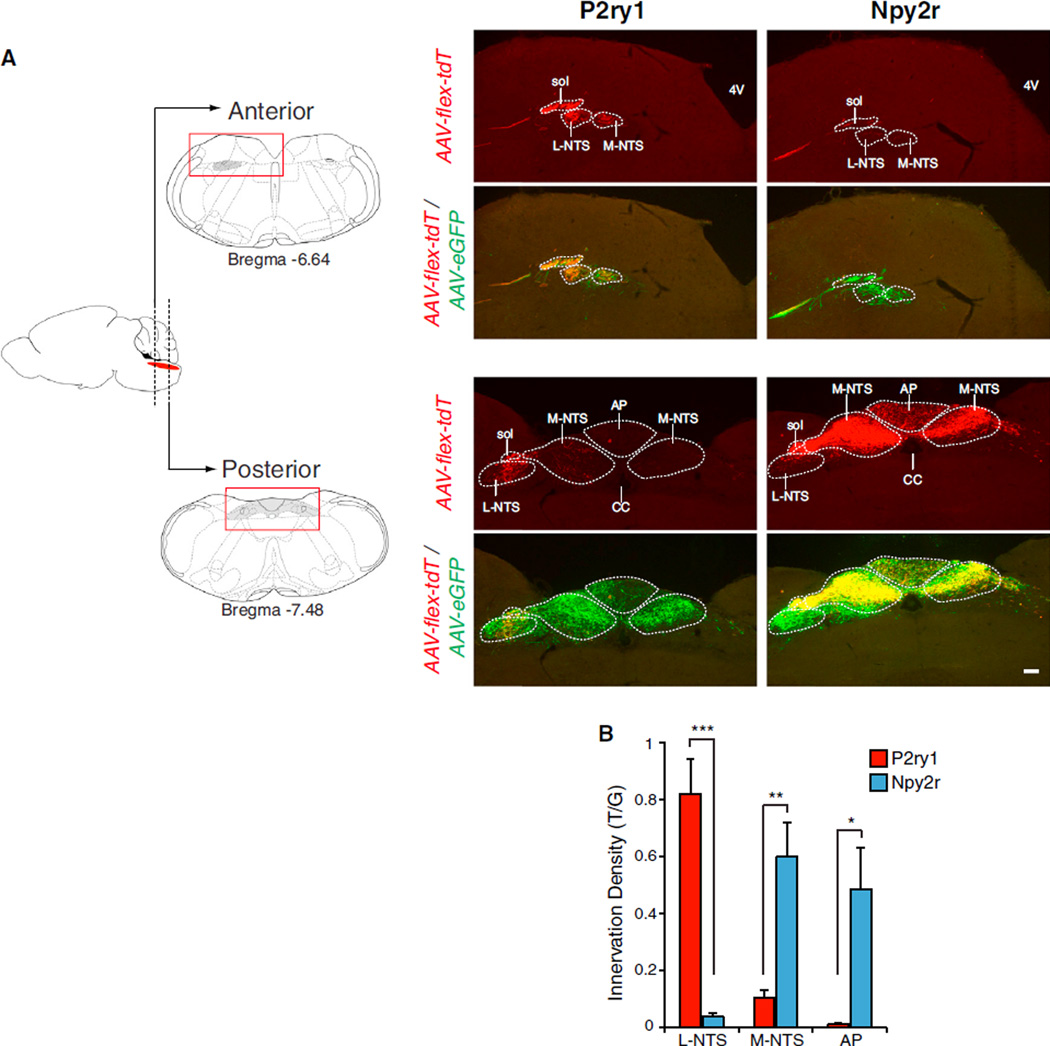
Figure 7. Non-Overlapping Central Projections of Vagal P2ry1 and Npy2r Neurons.
(A) The nodose/jugular complex of P2ry1-ires-Cre and Npy2r-ires-Cre mice was infected with AAV-flex-tdTomato (AAV-flex-tdT) and AAV-eGFP. At 4 weeks after infection, fixed brainstem cryosections were analyzed by two color immunohistochemistry for tdTomato (red) and eGFP (green). Representative images of anterior and posterior brainstem containing the vagal projection field are shown (full rostral-caudal series, Figure S7). Solitary tract, sol; fourth ventricle, 4V; central canal, CC; area postrema, AP; L-NTS includes ventral, lateral, ventrolateral, interstitial, and intermediate NTS subnuclei; and M-NTS includes dorsolateral, dorsomedial, medial, and commisural NTS subnuclei. Scale bar, 100 µm.
(B) Quantitative analysis of innervation by P2ry1 and Npy2r fibers in L-NTS, M-NTS, and AP, expressed as an area ratio of T/G fluorescence. Fluorescence was summed in every eighth section (25 µm) from Bregma −6.4 mm to −7.8 mm. (n = 4, mean ± SEM, *p < 0.05, **p < 0.01, and ***p < 0.001). See also Figure S7.

