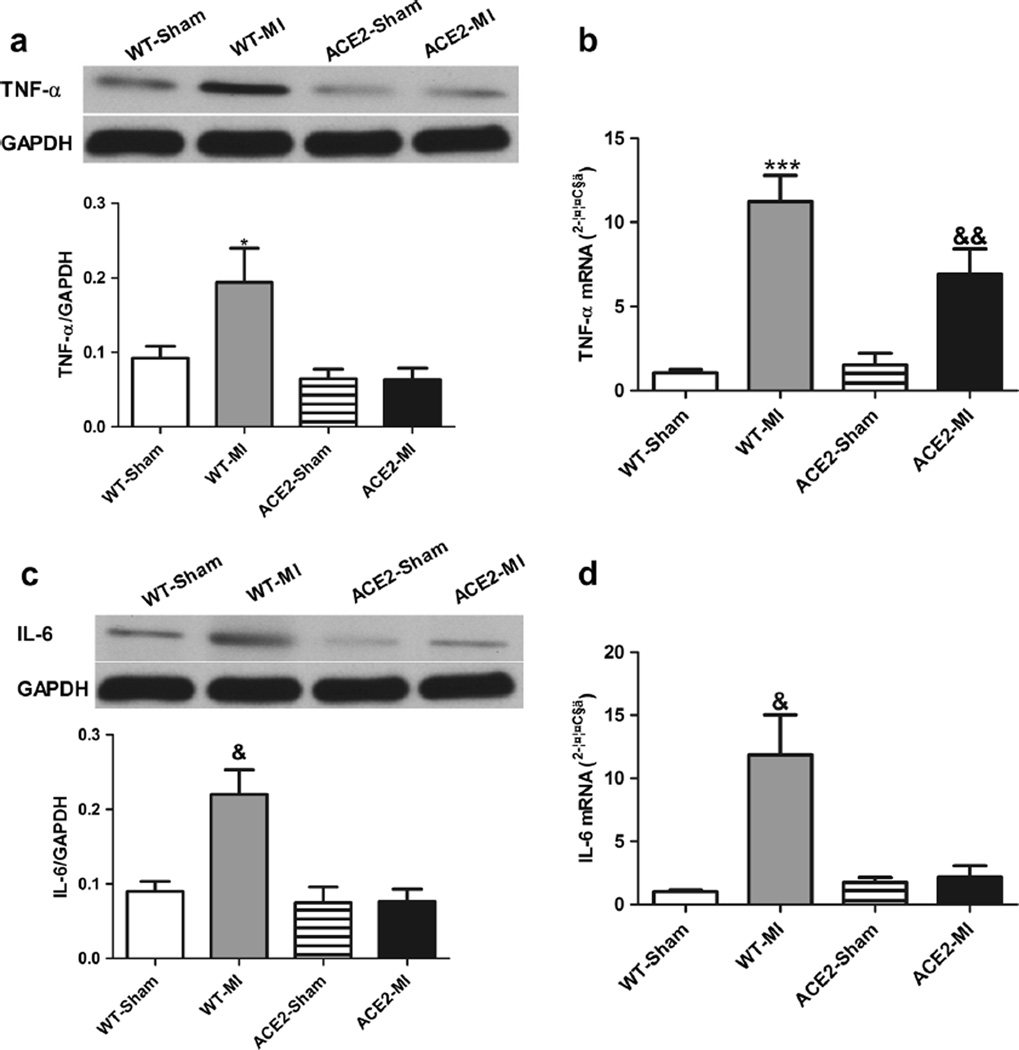
Fig. 6.
Overexpression of ACE2 attenuates inflammatory following MI. Representative western blots and corresponding densitometric analysis and mRNA levels of TNF-α (a, b) and IL-6 (c, d). Values are means±SE, n=4–6/group; *p<0.05 WT-MI vs. ACE2-Sham and ACE2-MI;&p<0.05 WT-MI vs. all other groups; ***p<0.01 WT-MI vs. WT-Sham and ACE2-MI; &&p<0.05 ACE2-MI vs. WT-Sham and ACE2-Sham

