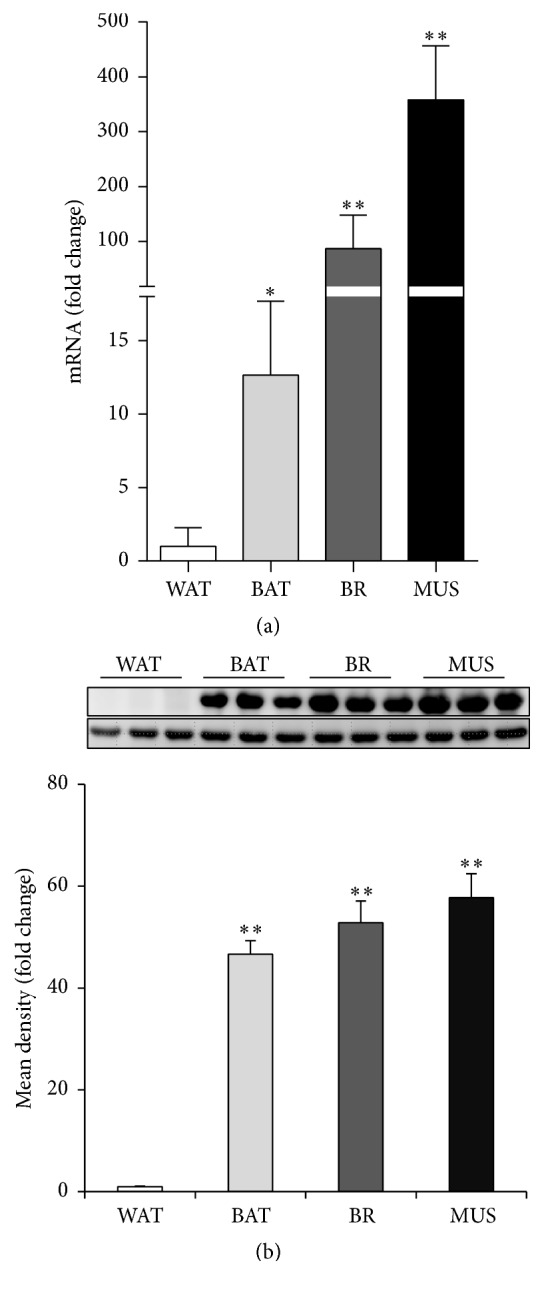
Figure 1.

Higher expression of EN1 in BAT than in WAT. (a) The mRNA expression and (b) protein expression of EN1 in WAT, BAT, BR, and MUS were analyzed. Relative levels of EN1 protein were calculated based on densitometry analysis (bottom panel of (b)). Data are mean ± SEM. ∗ p < 0.05, ∗∗ p < 0.01, n = 3–5.
