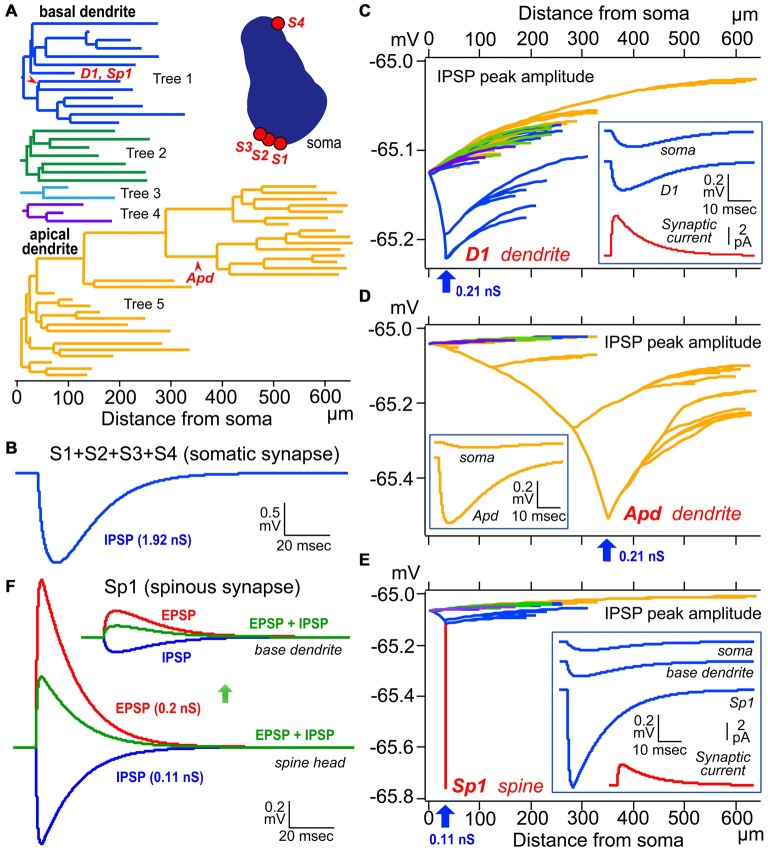
Figure 6.
Simulation analysis of inhibitory postsynaptic potential (IPSP) on dendritic spine, shaft and somatic IPSCs. (A) Left, color-coded dendrogram with inhibitory synaptic current injection sites on the dendrites (red arrowheads). Right, a cross-section of the cell body of the model pyramidal cells with four somatic synaptic contacts. (B) The simulated IPSP wave-form at the soma induced by injection of a total of 1.92 nS inhibitory conductance summed across the somatic synapses S1–S4. (C) Peak dendro-somatic potential changes (color-coded as in A) induced by an inhibitory conductance of 0.21 nS (inset, red trace, simulated synaptic current) injected into the shaft of a basal dendritic branch (D1, blue arrow; corresponding to D1 in A). The simulated IPSP wave-forms at the injection site (D1) and soma are shown in the inset (blue traces). Resting potential is −65 mV. (D) Peak dendro-somatic potential changes induced by an inhibitory conductance of 0.21 nS (simulated IPSC is quite similar to the red trace shown in inset in C, red trace) injected into the shaft of an apical dendritic branch (Apd, blue arrow; corresponding to Apd in A). The simulated IPSP wave-forms at the injection site (Apd) and soma are shown in the inset (yellow traces). Resting potential is −65 mV. (E) Peak membrane potential changes over the somato-dendritic membrane induced by an inhibitory conductance of 0.11 nS injected at the spine head Sp1 (blue arrow, corresponding to Sp1 in A; simulated IPSC shown in red trace in inset). Peak inhibitory potential in the spine is indicated in red. The simulated IPSP wave-forms at the injection site (Sp1), base of dendrite and soma are shown in inset (blue traces). (F) Reduction (green) of the excitatory postsynaptic potential (EPSP) resulting from the injection of an EPSC waveform (with peak conductance of 0.2 nS; red) at the Sp1 spine head (lower superimposed traces) and base dendrite locus (upper superimposed traces)) by an IPSC (0.11 nS; blue) injected at the same site and time. Adapted from Kubota et al. (2015). The simulations were made with “NEURON” (Hines and Carnevale, 1997) and the CS56 pyramidal cell model neuron publicly available at ModelDB (Accession no: 183424; http://senselab.med.yale.edu/ModelDB/showModel.cshtml?model=183424. The datasets are also available at http://www.nips.ac.jp/circuit/).

