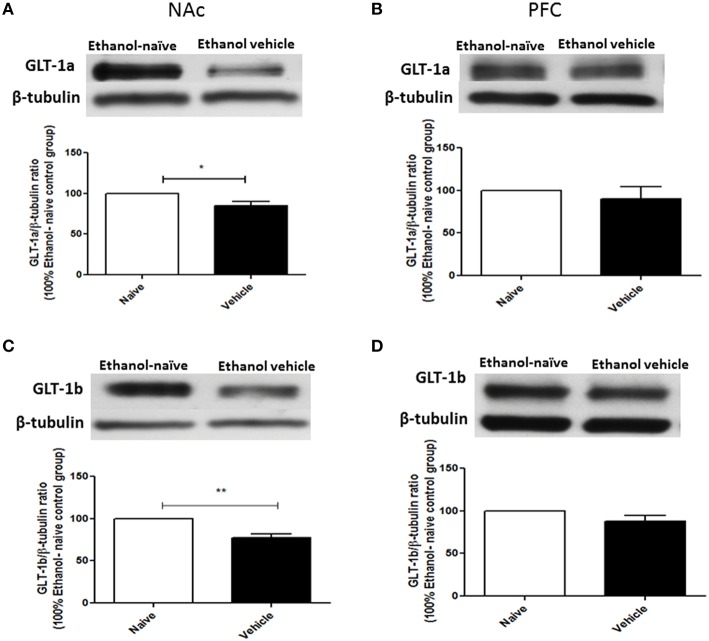
Figure 2.
Effect of chronic ethanol consumption on GLT-1 isoforms (GLT-1a and GLT-1b) expression in NAc and PFC. (A) Statistical analysis showed significant downregulation of GLT-1a expression in ethanol vehicle group as compared to ethanol naïve (water) group in NAc. (B) Statistical analysis showed no significant difference of GLT-1a expression in PFC between ethanol naïve and ethanol vehicle groups. (C) Statistical analysis revealed significant downregulation of GLT-1b expression in ethanol vehicle group as compared to ethanol naïve group in NAc. (D) Statistical analysis also revealed no significant difference of GLT-1b expression in PFC between ethanol naïve and ethanol vehicle groups. Data are shown as mean ± SEM; (*p < 0.05, **p < 0.01); (n = 5 for each group).

