


Figure 3.
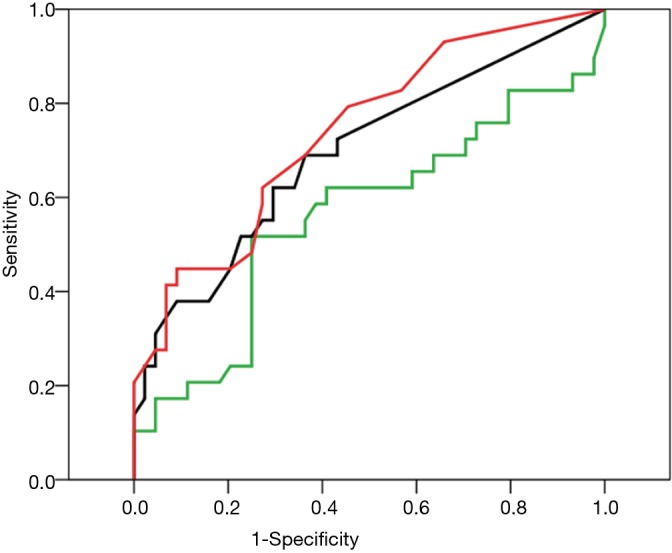
Receiver operating characteristic curve analyses for unfavorable brightness (definitive value was ΔIntensity <20), the relationship of clinical characteristics was plotted against specificity and sensitivity. Green, %FEV1.0; black, SI; blue, BMI; red, LAA. %FEV1.0, ratio of forced expiratory volume in 1 s to forced vital capacity; SI, smoking index; BMI, body mass index; LAA, low attenuation area.