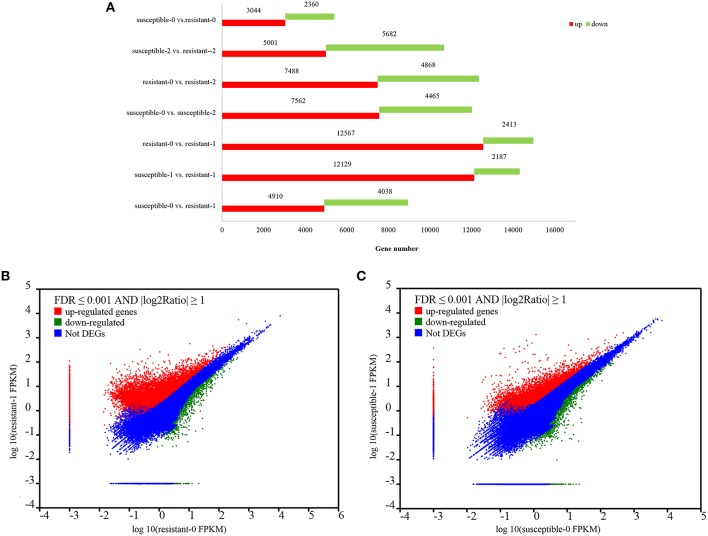
Figure 2.
Statistics of up- and down-regulated genes between the two L. multiflorum lines (A); The expression level of DEGs in resistant and susceptible lines exposed to drought (B–C). The upper with red regions reveal those genes with significantly up-regulated expression. Similarly, the lower with green dots shows the down-regulated genes and the blue dots represent the region with no DGEs.

