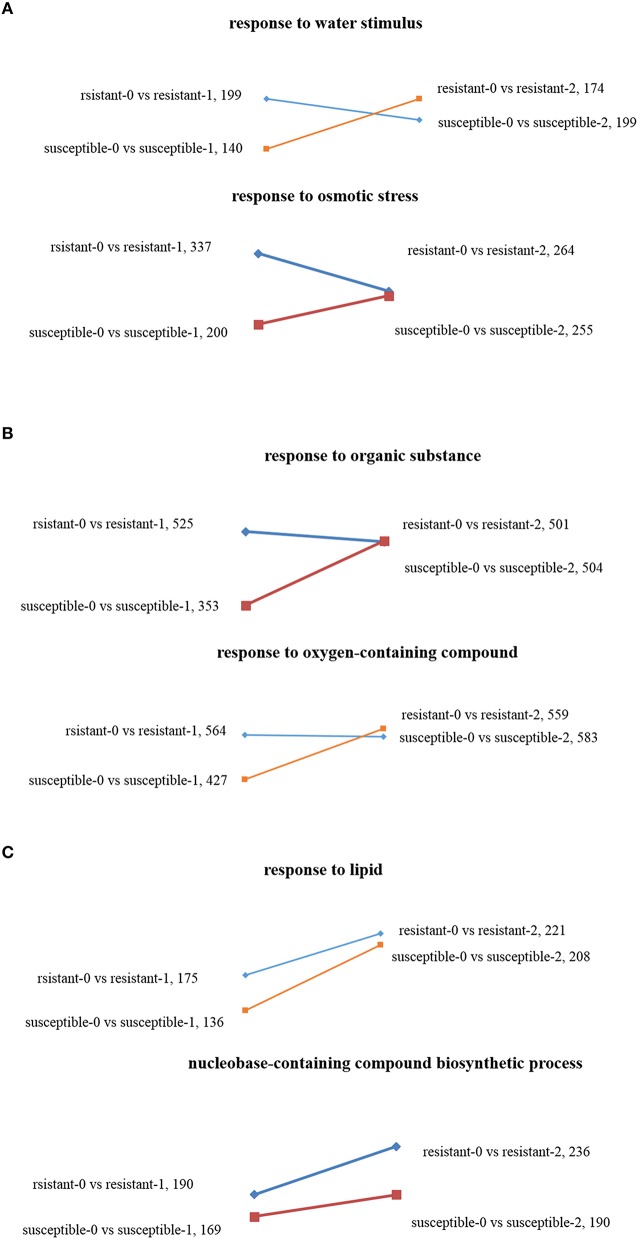
Figure 4.
Scatter diagrams of different changing trends of DEGs in two L. multiflorum lines by GO enrichment analysis after drought treatment for 1 and 2 h. The GO terms included response to osmotic stress and response to a water stimulus (A), response to an organic substance and response to an oxygen-containing compound (B), and response to lipid and nucleobase-containing compound biosynthetic process (C).

