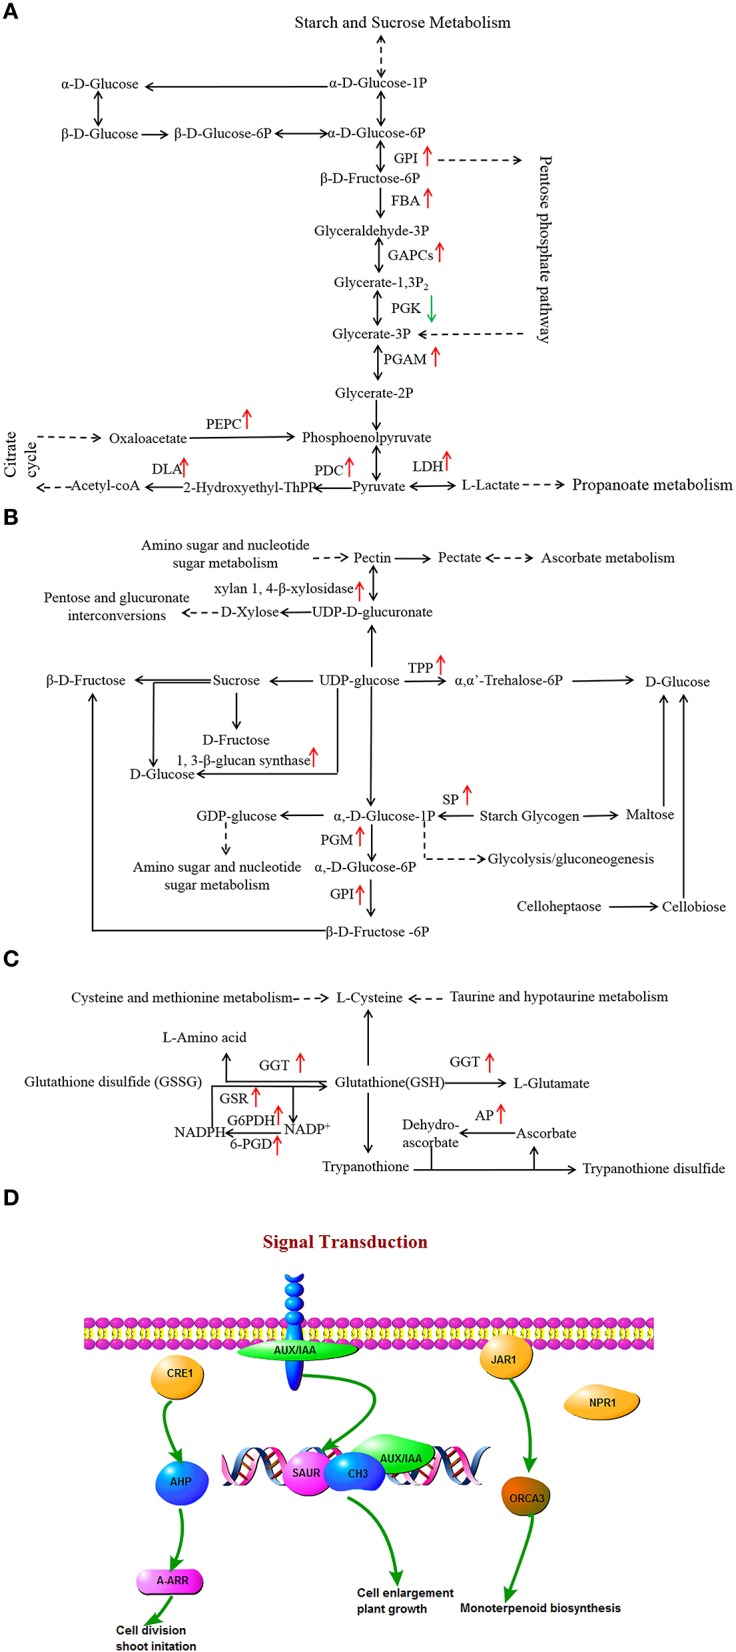
Figure 6.

Effects of drought stress on the expression of genes associated with glycolysis and gluconeogenesis (A), starch and sucrose metabolism (B), glycerophospholipid metabolism (C), and signal transduction (D) in resistant lines. The red arrow indicates significantly up-regulated expression.
