
Figure 1.
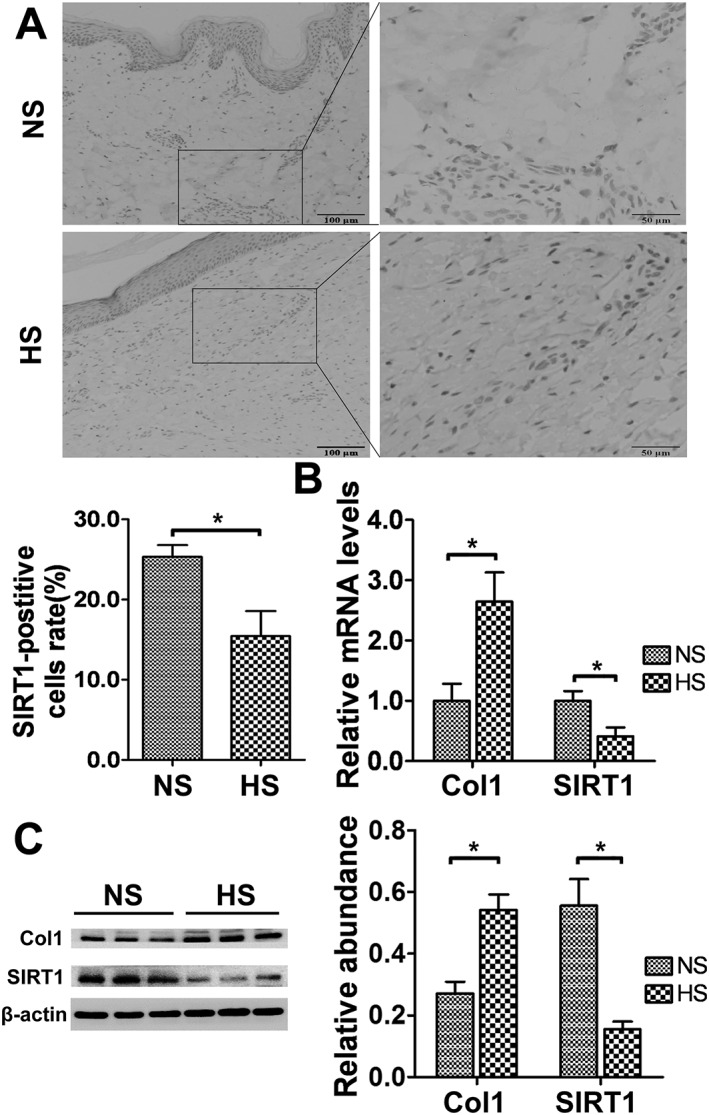
Decreased SIRT1 expression in hypertrophic scar tissues. (A) Representative immunohistochemical staining for SIRT1 in normal skin (NS) and hypertrophic scar (HS) tissues (scale bar = 50 μm). The average SIRT1‐positive cell rate was calculated (n = 6). (B) SIRT1 and Col1 mRNA expression levels in NS and HS tissues were analysed by real‐time PCR and normalized to GAPDH (n = 6). (C) Representative western blot analysis for SIRT1 and Col1 in NS and HS tissues (n = 6). The results represent the mean ± SEM of six independent experiments. *P < 0.05.