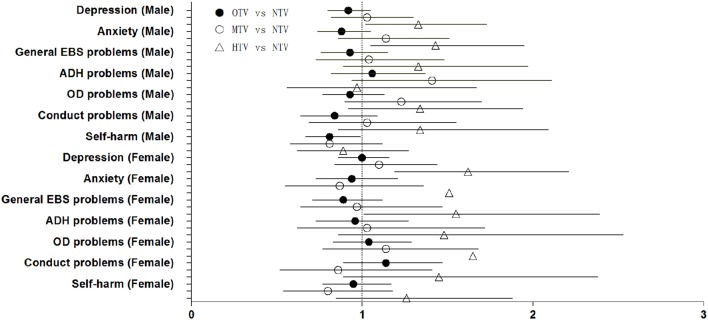
FIGURE 1.
Forest plot of the association between psychiatric sympotoms, self-harm and school day television time (h/day). Logistic regression results (Detailed odds ratios and corresponding 95% confidence intervals are given in Table 4); NTV, non-television; OTV, occasional television (>0 to ≤1 h/day); MTV, moderate television (>1 to ≤2 h/day); HTV, high television (>2 h/day); General EBS problems, genera emtional, behavioral, and social problems; ADH problems, attention deficit/hyperactivity problems; OD problems, oppositional defiant problems.

