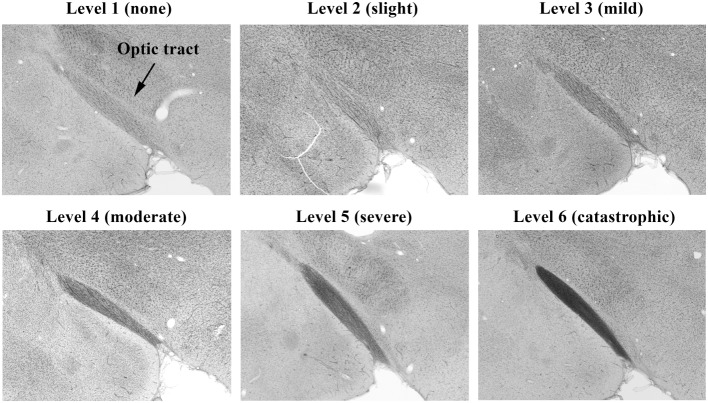
Figure 4.
Histopathology of brains from right side-blasted rats at 14 days following exposure. Representative rat brain cross sections for the optic tract relative damage scoring scale, 1–6 (silver stained; 4× objective lens with 60% camera-zoom magnification). Arrow in first panel (level 1; none) denotes position of optic tract region in the brain sections. The overall degree of brain axonal damage is shown above each frame.

