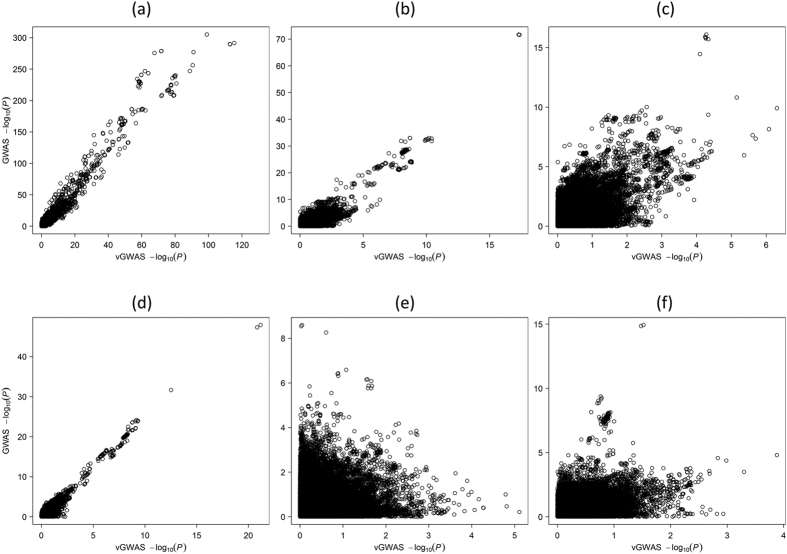
Figure 3. Concordance plots of GWAS P values against vGWAS P values.
(a) the Combined cohort using all SNPs; (b) the Combined cohort excluding SNPs within the MHC region; (c) the Combined cohort excluding SNPs within the MHC and PTPN22 regions; (d) the RACI-UK cohort excluding SNPs within the MHC region; (e) the RACI-US cohort excluding SNPs within the MHC region; (f) the RACI-SE cohort excluding SNPs within the MHC region.

