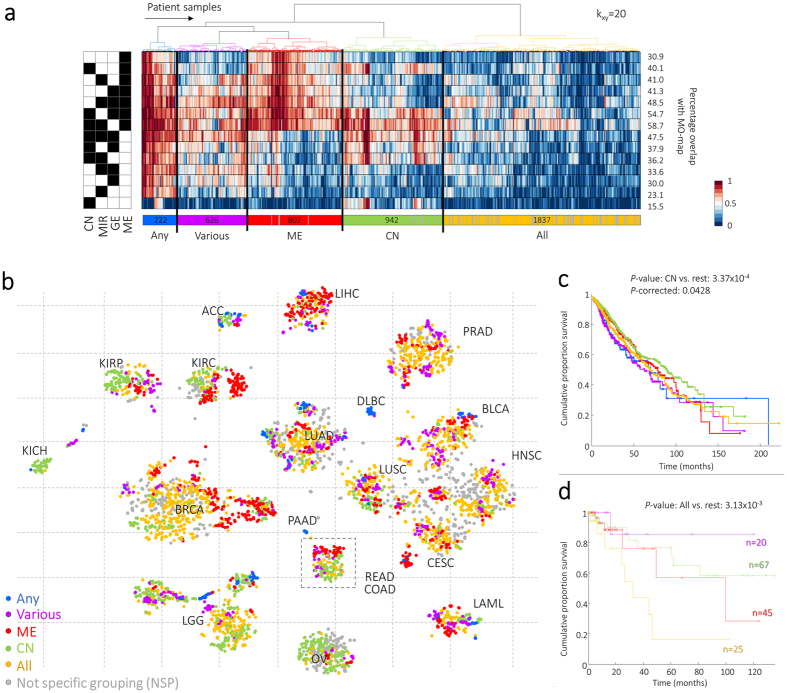
Figure 3. Single data-type versus integrated approach.
(a) The fourteen alternative molecular data-type combinations with their unique sample projection are pairwise compared with the MP-approach, for kxy = 20-nearest neighbours. The percentage of overlap with the MO-map that is derived for each of the 4,434 patient samples is subsequently hierarchically clustered based on Euclidean distance and ward linkage. Percentages depicted at the right column describe the averages per molecular data-type over all samples. (b) Colouring the MO-map based on the cluster labels to demonstrate the contribution of combinations of data-types. (c) Kaplan-Meier plot of overall survival for the different genomic profiles in (a). P-corrected demonstrate the P-value after correcting for the covariates age, sex and for cancer-tissue type since survival rates per cancer are quite different. (d) Kaplan-Meier plot of overall survival for the different genomic profiles for only COAD/READ samples.

