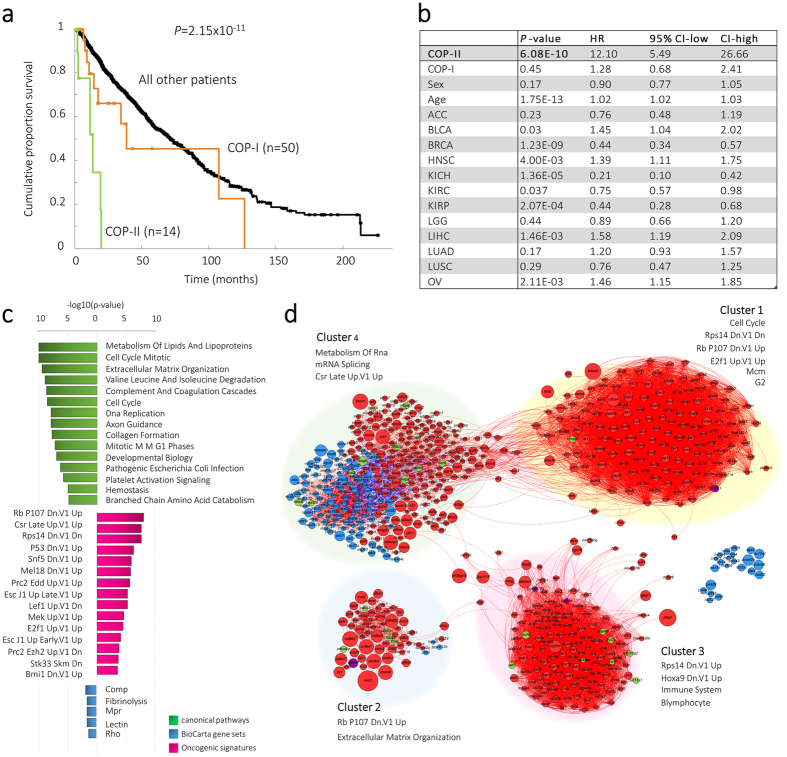
Figure 6. Analysis of the COP cluster with similar profiles.
(a) Kaplan-Meier survival plot depicted the overall survival (OS) for the COP-I, COP-II and all other remaining samples. The P-value describes the comparison between COP-II samples versus all other samples using the log-rank statistics. (b) Cox proportional hazard ratio regression model to determine associations with OS for COP-I and COP-II samples groups after correcting for covariates. The covariates are chosen based on the cancer-tissues that were seen among the COP samples. (c) Significantly enriched pathways for the COP-II sample group. (d) Co-expression network based on gene expression profiles for the COP-II sample group. Node size depicts the −log10(P-value) for differential expression between COP-II sample group and all other remaining samples. Node color depicts either significant upregulation (red), downregulation (blue), DNA-methylation (green), or copy-number changes (purple). Edges with positive correlation are depicted in red, whereas negative correlations are depicted in blue. Co-expression network is clustered in four distinct groups and significantly enriched pathways for each cluster are depicted.

