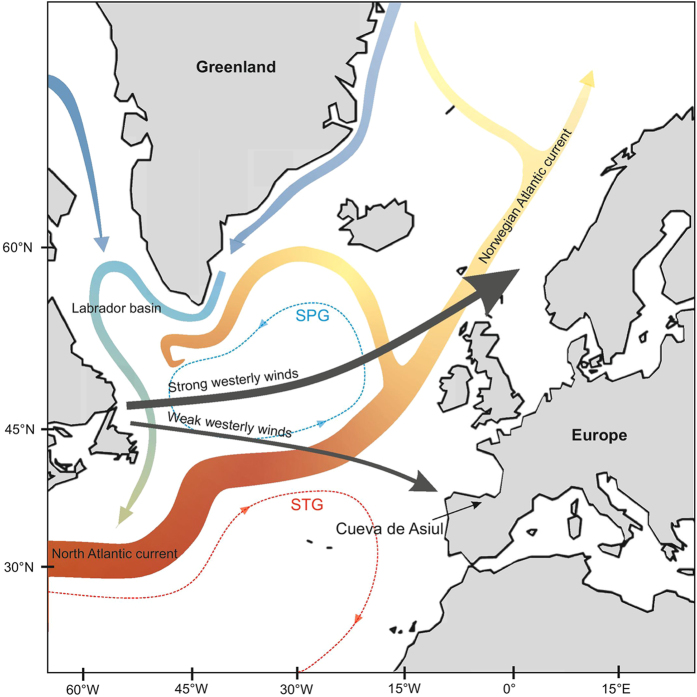
Figure 1. Map of the North Atlantic region.
Highlighting the position of Cueva de Asiul and showing the positioning of major thermohaline ocean currents, the sub polar and subtropical gyres and the variable positioning of westerly wind tracks under positive and negative NAO conditions. Image created by ACS in CorelDRAW X6; http://www.coreldraw.com.

