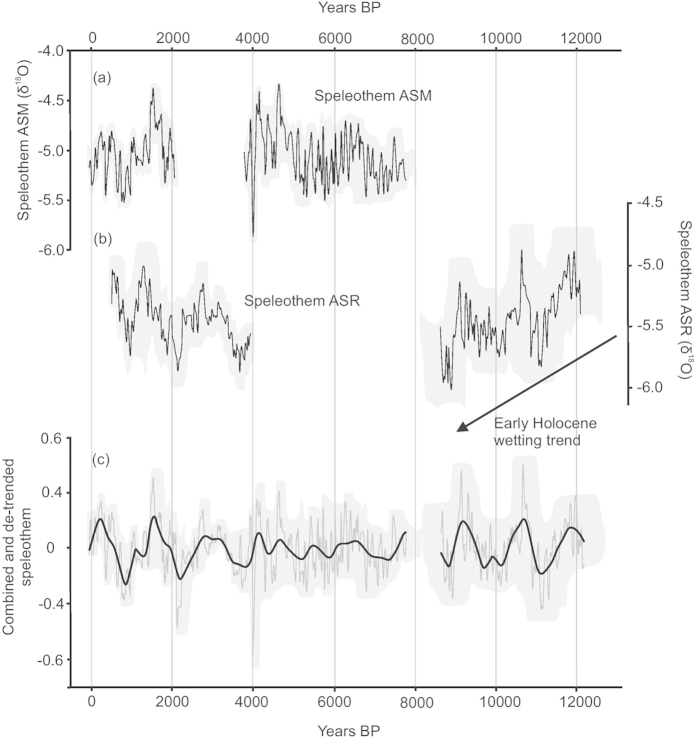
Figure 2. Cueva de Asiul speleothem δ18O data.
(a) Raw speleothem δ18O (‰, VPDB) for sample ASM and (b) ASR, grey boundaries denote the measurement error (0.1‰) and the variable timing error based on the StalAge model. (c) Combined and detrended speleothem data (thin grey line) with the underlying trend of this data (black line) as defined by DHR analysis (see supplementary information), again grey boundaries denote the associated errors.

